Publication date: October 2026 Scope: How tensor-parallel (TP) inference uses the network between DGX Spark systems, how to estimate the effect of halving the link speed from the model’s architecture and the inference engine’s settings, and a measured comparison of 200 Gb/s and emulated 100 Gb/s links on 8× DGX Spark with GLM-5.3 at TP8. Note: The measurements apply to the model, inference engine, versions and settings listed in Section 7. The estimation method of Sections 3–6 carries over to other models and settings; the measured numbers do not.
Prepared by: Openzeka Teknoloji A.Ş. — Official Embedded Compute Distributor for NVIDIA Türkiye & MEA, and NVIDIA Elite Partner
Table of contents
- Executive Summary
- 1. Introduction
- Part I: Theory
- Part II: Measurement
- 7. Test Design
- 8. Results: 200 Gb/s vs Emulated 100 Gb/s at TP8
- 9. From the Emulated Link to a Real 100G Cable
- 10. Projection: How the Penalty Changes with TP Size
- 11. Is 8 Sparks at 100 Gb/s Reasonable?
- 12. Limits and Points to Consider
- 13. Conclusion
- Appendix A: Measuring RDMA Traffic
- Appendix B: Reproducibility
- Glossary (Terms)
- Resources
Executive Summary
- The question: a DGX Spark cluster that serves one model with tensor parallelism across 8 systems needs fast switch ports. At 200 Gb/s per Spark, a MikroTik CRS812 connects 4 to 6 Sparks; at 100 Gb/s, it connects 8. A CRS804 connects 8 Sparks at 200 Gb/s or 16 at 100 Gb/s. This paper asks what 100 Gb/s per Spark costs in inference speed.
- How tensor parallelism uses the network: each Spark holds one eighth of every weight matrix, so each computes only part of every result. Twice per layer, the Sparks add their partial results together over the network in an operation called an all-reduce. While the prompt is processed (prefill), the data summed in each all-reduce is large; while the answer is generated (decode), it is small.
- The estimate: prefill transfers are large enough to run at the full link speed, so halving the link lengthens them and delays the first token. For GLM-5.3 at TP8, the estimate from the model’s architecture is at most 0.135 s of extra time to first token (TTFT) per 1,000 prompt tokens at 100 Gb/s. Decode transfers are too small for link speed to matter.
- Does the cluster use the full 200 Gb/s? Yes and no. Measured at millisecond resolution, prefill traffic reaches 150–200 Gb/s in bursts of a few milliseconds. Averaged over one second, the same traffic is about 40 Gb/s, and decode stays at a few Gb/s.
- Measured with GLM-5.3 at TP8, 200 Gb/s against an emulated 100 Gb/s link (which carries up to 109 Gb/s):
- decode speed does not change (−2.3% to +4.3%, within the variation between test rounds);
- TTFT grows by 12.6–13.9% for single prompts of 8K–64K tokens, about 0.11 s per 1,000 prompt tokens, close to the estimate;
- with four long prompts arriving together, each request’s TTFT grows by 17.9–22.5%;
- short prompts are not affected (+1% at 1K tokens).
- A real 100 Gb/s cable would add at most another 2.5–3.5 percentage points.
- Verdict: moving an 8-Spark TP8 cluster from 200 Gb/s to 100 Gb/s links, expect the first token to arrive at most about 20% later for a very long prompt, and at most about 30% later when several very long prompts arrive at the same time. Short to medium prompts see no change, and once the answer starts, it streams at the same pace. On 16 Sparks, run two TP8 clusters rather than one TP16 cluster: the penalty grows with TP size.
1. Introduction
A single DGX Spark holds 128 GB of unified memory. Models larger than that are served by splitting them across several Sparks connected through their ConnectX-7 network adapters and a switch. With tensor parallelism, every layer of the model is split across all the Sparks, so they exchange data many times for every token the model processes, and every step of inference waits for the network.
That makes the switch a design decision. Running each Spark at 100 Gb/s instead of 200 Gb/s lets a smaller switch serve the same 8 Sparks, or the same switch serve twice as many. Whether that is acceptable depends on how much tensor-parallel inference slows down when the link between the Sparks is half as fast.
Part I of this paper (Sections 2–6) describes what tensor parallelism sends over the network, why prompt processing and answer generation load the network very differently, and how to estimate the effect of halving the link speed from the model’s architecture, the inference engine’s settings and the link speed alone. Part II (Sections 7–10) measures 200 Gb/s against an emulated 100 Gb/s link on 8× DGX Spark serving GLM-5.3 at TP8, compares the results with the estimate, and converts them to a real 100 Gb/s cable. Section 11 gives the sizing answer for 8- and 16-Spark clusters.
Part I: Theory
2. The DGX Spark Network
2.1. The ConnectX-7 adapter and its two PCIe links
Each DGX Spark has a ConnectX-7 network adapter with two QSFP ports. The clusters in this paper use one port per Spark, cabled to the switch at a nominal link speed of 200 Gb/s.
The adapter is connected to the GB10 chip over PCIe Gen5, through two separate links of four lanes (×4) each. One ×4 link carries a little over 100 Gb/s of data (Section 7.3), not enough to keep a 200 Gb/s port busy on its own; two links together can. Linux sees the adapter once per PCIe link, so the single physical port appears twice: as two network interfaces (enp1s0f1np1 and enP2p1s0f1np1), each with its own RDMA device. Both interfaces report a link speed of 200 Gb/s, because both belong to the same port, but each can move only what its own PCIe link carries.
NCCL, the library the inference engine uses for communication between the Sparks, treats the two RDMA devices as two separate network paths and spreads its traffic across both; only together do they reach the port’s 200 Gb/s. The same arrangement makes the 100 Gb/s case of Part II possible without touching the hardware: restricting NCCL to one of the two interfaces limits every Spark to what one PCIe link can carry.
The traffic between the Sparks uses RDMA (remote direct memory access): the adapter reads data from the sending application’s memory and writes it directly into the receiving application’s memory, without the data passing through the operating system’s network stack. This keeps the delay of each transfer low. It is also why the usual Linux network statistics do not show this traffic (Appendix A). Here, RDMA runs over ordinary Ethernet using RoCE v2 (RDMA over Converged Ethernet, version 2), which carries RDMA packets inside UDP/IP.
2.2. The link is the slowest path in the system
200 Gb/s is 25 GB/s. A DGX Spark reads its own memory at 273 GB/s, about 11 times faster. Anything that has to cross the network between Sparks therefore moves far more slowly than anything a Spark reads from its own memory, which is why the amount of data tensor parallelism sends over the network, and how it is timed, decides how much the link speed matters.
2.3. Switches and breakout options
The CRS804 and CRS812 have 400 Gb/s QSFP-DD ports. A breakout cable splits each such port into several slower links, one per Spark:
| Switch | 400G QSFP-DD ports | Sparks at 200 Gb/s (2 × 200G per port) | Sparks at 100 Gb/s (4 × 100G per port) |
|---|---|---|---|
| MikroTik CRS812 | 2 (plus 2 × 200G QSFP56) | 4 (6 with the QSFP56 ports) | 8 |
| MikroTik CRS804 | 4 | 8 | 16 |
At 100 Gb/s per Spark, an 8-Spark cluster fits on a CRS812, and a CRS804 can serve 16 Sparks.
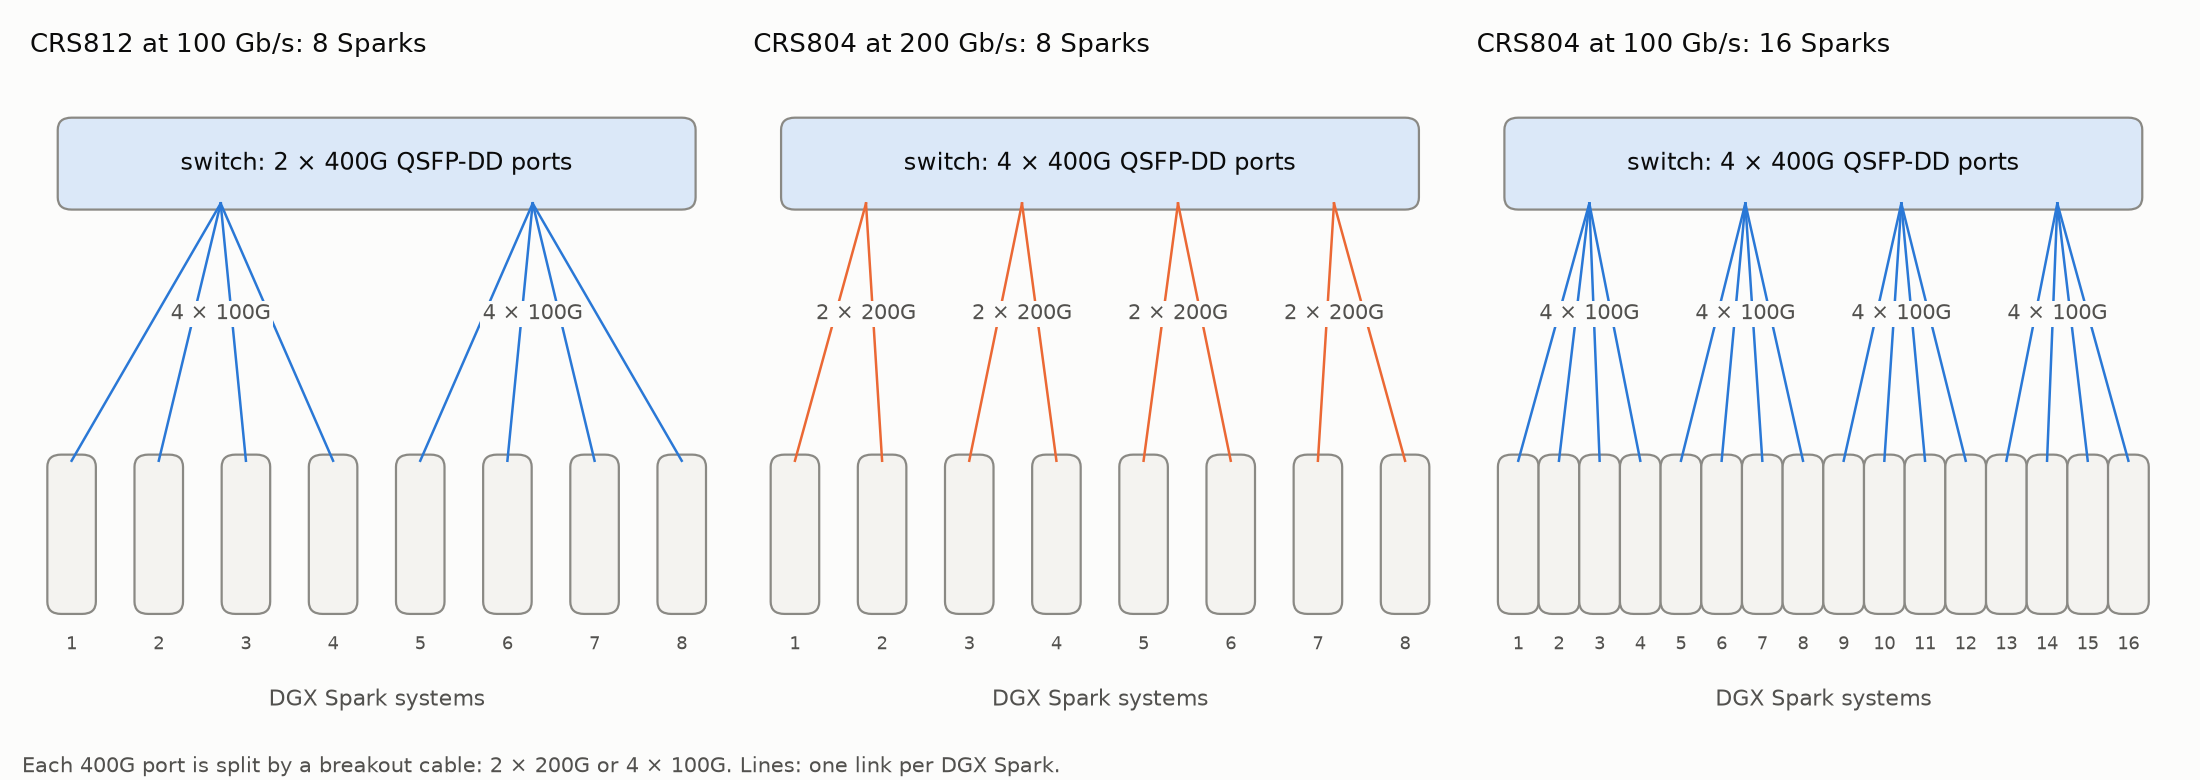
Figure 1: Breakout options, one link per DGX Spark.
3. How Tensor Parallelism Uses the Network
3.1. Splitting the model
In tensor parallelism with 8 Sparks (TP8), every large weight matrix of the model is cut into 8 slices, and each Spark holds one slice. In the attention blocks, the attention heads are divided among the Sparks. In the feed-forward and Mixture-of-Experts (MoE) blocks, every expert’s matrices are sliced as well, so each Spark holds a part of every expert. Each Spark reads only its own eighth of the weights from its own memory, which is what lets a model larger than one Spark fit, and run faster than it would if each Spark had to read everything.
3.2. Partial results and the all-reduce
Splitting a weight matrix this way means that no Spark can finish a multiplication on its own. Each output value of a layer is a long sum of products of weights and inputs; with the weights divided eight ways, each Spark computes one eighth of that sum. The values involved are the model’s activations: the vectors that represent each token as it passes through the layers. GLM-5.3 represents each token as a vector of 6,144 values (its hidden dimension). For a prompt processed 4,096 tokens at a time, every Spark ends up holding 4,096 × 6,144 partial values, which is 50.3 MB at 2 bytes per value. The actual result is the sum of the eight Sparks’ blocks, and every Spark needs that full sum before the model can continue.
Producing it is the job of an all-reduce: reduce because the blocks are combined (here, added), all because every participant receives the result. A transformer layer needs two, one after the attention block and one after the feed-forward or MoE block, and one more is needed at the input embedding. Every Spark waits at each all-reduce until all eight have contributed, so the network sits on the path of every layer.
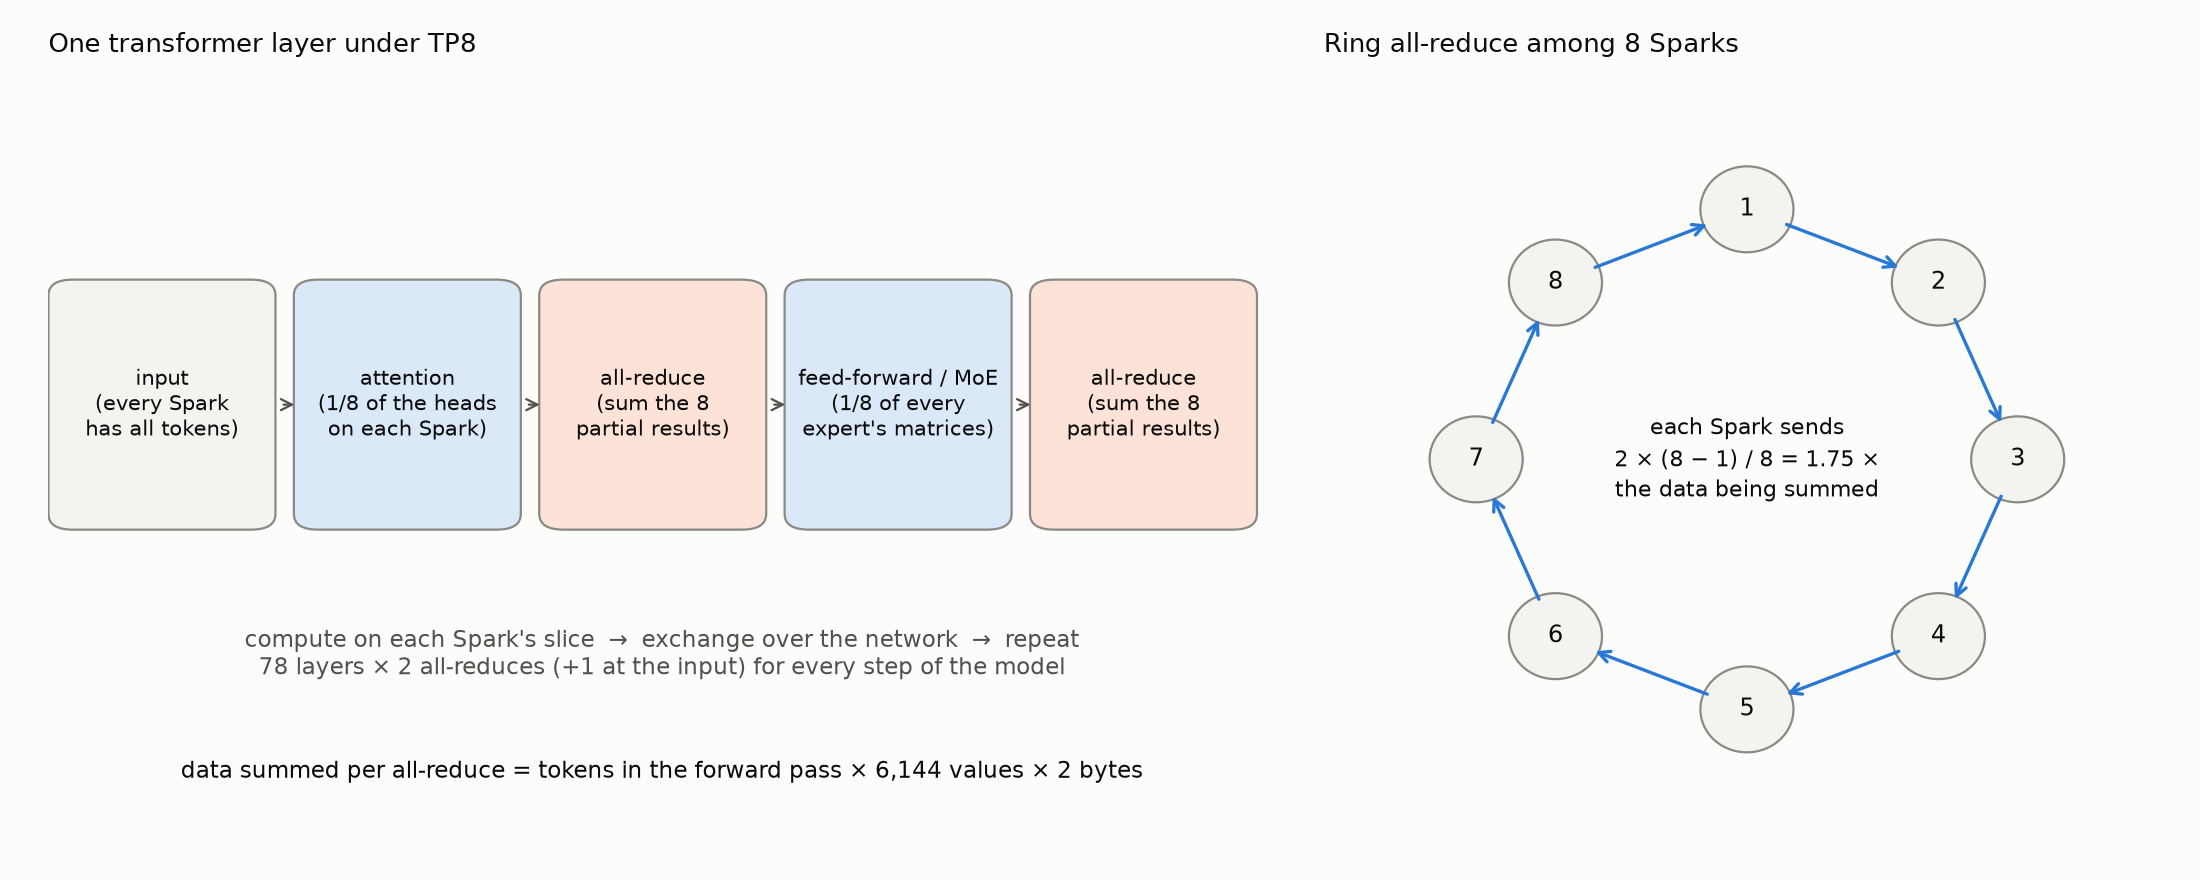
Figure 2: One transformer layer under tensor parallelism, and the ring all-reduce among 8 Sparks.
3.3. How the ring all-reduce works
The direct approach, every Spark sending its whole block to the other seven, would make each Spark send 7 × 50.3 MB, and the load would grow with every Spark added. NCCL commonly uses a ring instead. The Sparks are arranged in a circle, each sends only to the next one, and each block is cut into as many segments as there are Sparks. The work then runs in two phases, shown for four Sparks in Figure 3.
In the first phase, reduce-scatter, each Spark sends one segment to the next Spark in every ring step, and the receiving Spark adds it to its own copy of that segment. Every Spark works on a different segment at the same time, so after N − 1 ring steps each Spark holds the complete sum of exactly one segment. In the second phase, all-gather, the finished segments travel around the ring once more, copied rather than added, until after another N − 1 ring steps every Spark has the full sum.
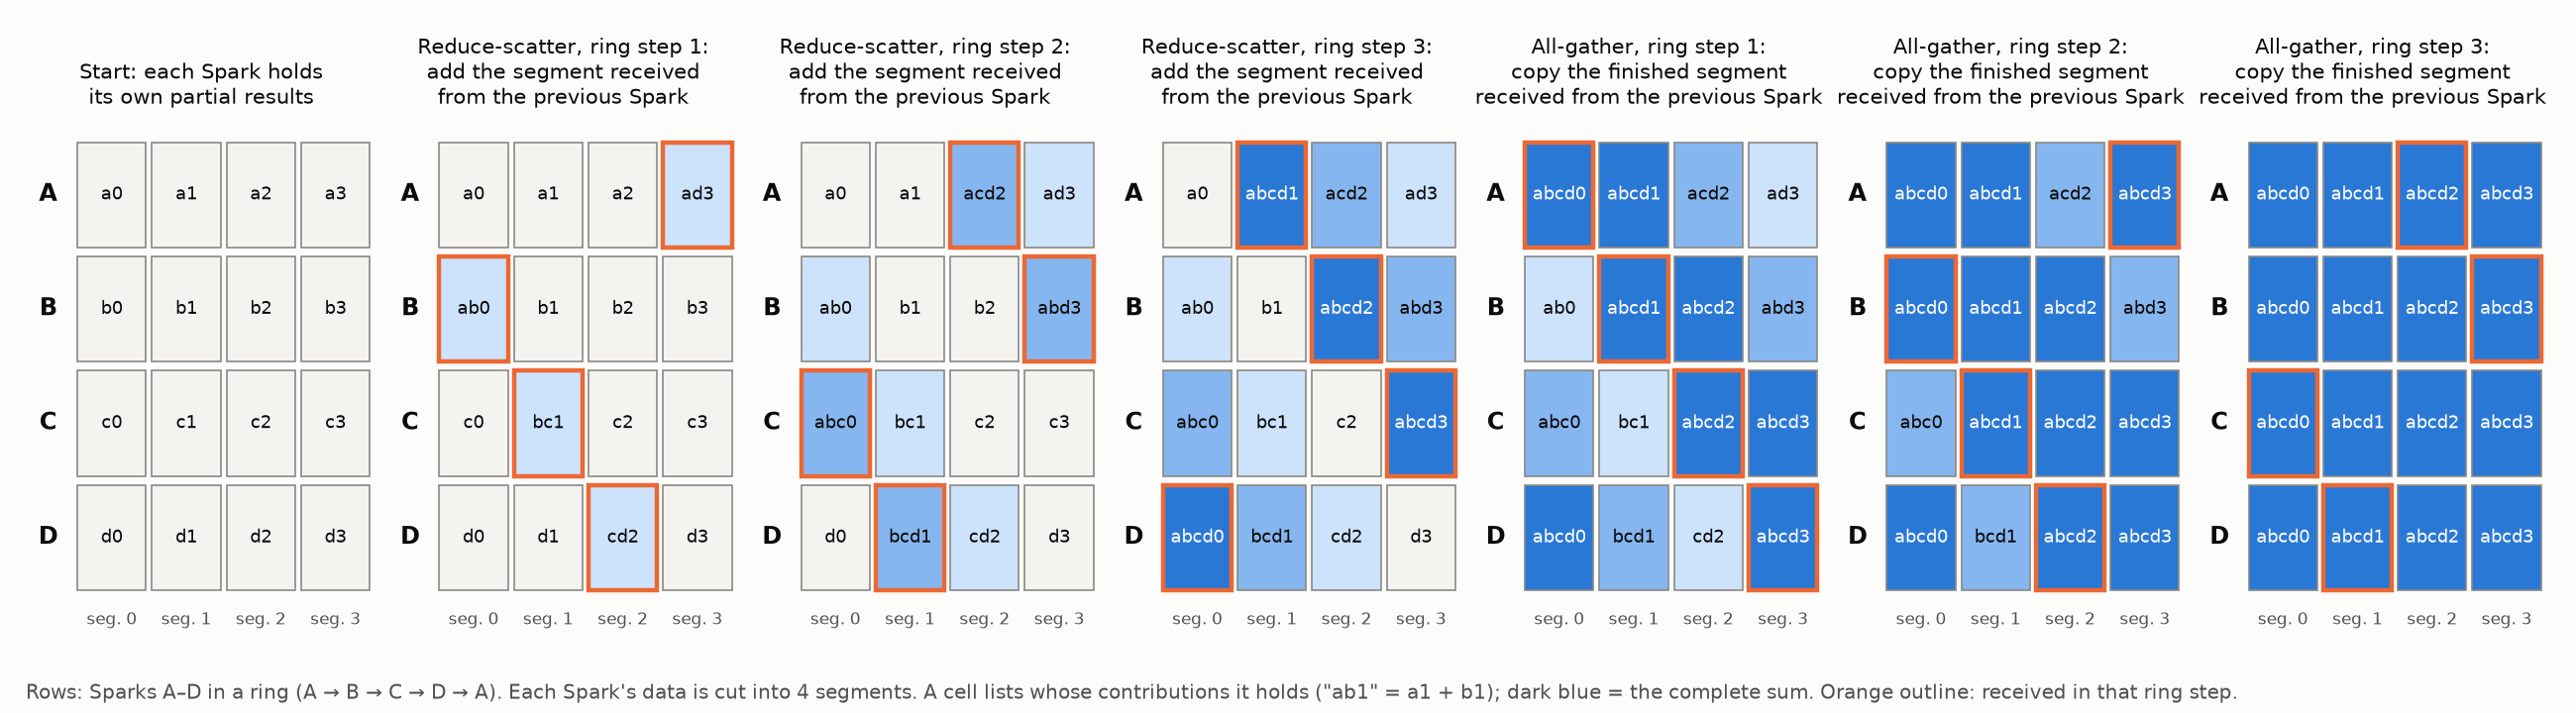
Figure 3: Ring all-reduce among four Sparks. After the three reduce-scatter steps, each Spark holds one complete sum; after the three all-gather steps, every Spark holds all four.
In each of the 2 × (N − 1) ring steps, a Spark sends one segment, 1/N of its block. Each Spark therefore sends 2 × (N − 1) / N times the block in total: 1.75× for eight Sparks, and never more than 2× however many take part. For GLM-5.3 at TP8, each Spark sends 1.75 × 50.3 MB = 88.1 MB per all-reduce, in 14 ring steps of about 6.3 MB. Since every Spark sends the same amount, the traffic measured on one Spark represents all eight.
Summed over every all-reduce in the model (78 layers × 2, plus 1), each prompt token costs each Spark
(2 × 78 + 1) × 6,144 values × 2 bytes × 1.75 = 3.38 MB of network traffic.
NCCL can choose other all-reduce algorithms, which send different amounts; Part II checks this figure against the measured traffic.
3.4. What changes with the number of Sparks
Adding Sparks divides the computation, but not the data that has to be summed. Only the weights are split: each Spark computes a part of the sum for every output value, so its block of partial values stays 4,096 × 6,144 values (50.3 MB) whether the model runs on two Sparks or sixteen. Each doubling of the TP size halves each Spark’s computation, while the amount each Spark sends per all-reduce, 2 × (N − 1) / N times the block, grows slightly:
| TP size | Computation per Spark | Sent per Spark per all-reduce |
|---|---|---|
| TP2 | 1/2 of the model | 1.0 × 50.3 MB = 50.3 MB |
| TP4 | 1/4 | 1.5 × 50.3 MB = 75.5 MB |
| TP8 | 1/8 | 1.75 × 50.3 MB = 88.1 MB |
| TP16 | 1/16 | 1.875 × 50.3 MB = 94.3 MB |
Going from TP8 to TP16 thus halves the time each Spark spends computing but leaves the time it spends sending almost unchanged, so the network takes a larger share of every forward pass. Section 6.3 works out what this means for link speed.
4. Prefill and Decode: Two Different Loads on the Network
Inference runs in two phases that use the network in opposite ways. How much data each all-reduce carries depends on how many tokens one forward pass through the model processes, which the inference engine’s settings decide; the values below follow the vLLM configuration used in Part II.
4.1. Prefill: large transfers at full link speed
During prefill, vLLM processes the prompt in prefill chunks of up to 4,096 tokens per forward pass (--max-num-batched-tokens 4096), so each all-reduce sums the 50.3 MB block of Section 3.2 and each Spark sends 88.1 MB:
| Link speed | Time to send 88.1 MB |
|---|---|
| 200 Gb/s | 3.5 ms |
| 100 Gb/s | 7.0 ms |
Every transfer also carries some fixed overhead in software, synchronisation and the network hardware. Even a generous 100 µs of such overhead is small next to these times: at 200 Gb/s the link moves only 2.5 MB in 100 µs, against the 88.1 MB to be sent. The duration of a prefill all-reduce is therefore set almost entirely by how fast the link moves bytes; in other words, prefill communication is bandwidth-bound. Between all-reduces the Sparks compute the next part of the layer, so prefill traffic should appear as bursts of a few milliseconds at or near full link speed, separated by gaps of computation. Halving the link speed doubles the length of every burst and delays the first token.
4.2. Decode: small transfers dominated by fixed delays
During decode, each forward pass processes only the newest token of each request. With speculative decoding by multi-token prediction (MTP), as configured in Part II, the model also checks 4 draft tokens in the same pass, so it processes 5 tokens per request. Each all-reduce then sums 5 × 6,144 × 2 bytes = 61 KB, of which each Spark sends about 108 KB. Per forward pass, including collecting the output layer’s token scores, each Spark sends about 18 MB.
Sending 108 KB takes 4.3 µs at 200 Gb/s and 8.7 µs at 100 Gb/s. The all-reduce, however, passes through 14 ring steps in sequence, and each one carries a fixed delay of software, synchronisation and network hardware. RDMA transfers between two systems take on the order of microseconds even for tiny amounts of data, so these delays add up to more than the time spent sending bytes. Decode communication is therefore latency-bound, and its duration depends little on the link speed.
The total amount of decode traffic is also limited. Every forward pass must at least read the model’s active weights from memory. GLM-5.3 has about 40 billion active parameters per token, most stored in NVFP4, NVIDIA’s 4-bit floating-point format, at about 4.5 bits per weight including its scaling factors. That is about 2.8 GB per Spark, which takes at least 10 ms to read at 273 GB/s. Even if every forward pass ran at that limit, decode traffic would stay at or below about 14 Gb/s for one request, far below 100 Gb/s, and halving the link would add at most 0.7 ms to each pass of 10 ms or more. In practice it adds much less, because the transfers are latency-bound.
The network therefore decides how fast a prompt is read, not how fast the answer is written. Workloads with long prompts, such as retrieval-augmented generation, long documents or agents with large contexts, are where link speed matters. Short chat prompts hardly touch it, and decode speed should not change at all.
5. Estimating the Effect of Halving the Link
5.1. The upper bound
If every prefill transfer runs at the full link speed and none overlaps with computation, then lowering the link speed from B_old to B_new adds exactly the extra time needed to send the same bytes:
extra prefill time ≤ prefill bytes per Spark × (1 / B_new − 1 / B_old)
This is an upper bound: transfers that overlap with computation, or never reach full speed, add less. It needs only the bytes per prompt token from Section 3.3 and the prompt length, and nothing about how fast the Sparks compute.
From 200 to 100 Gb/s, (1/100 − 1/200) = 1/200, so the extra time equals the time the prefill bytes take to send at 200 Gb/s. For GLM-5.3 at TP8:
extra TTFT ≤ 3.38 MB × 8 bits ÷ 200 Gb/s = 0.135 s per 1,000 prompt tokens
5.2. The six test cases
| Test | Prompt tokens | Prefill bytes per Spark | Extra prefill time, 200 → 100 Gb/s |
|---|---|---|---|
| P1: 1K prompt, 1 request | 1,024 | 3.5 GB | ≤ +0.14 s |
| P2: 8K prompt, 1 request | 8,192 | 27.7 GB | ≤ +1.11 s |
| P3: 32K prompt, 1 request | 32,768 | 110.6 GB | ≤ +4.43 s |
| P4: 4 × 8K prompts, arriving together | 32,768 | 110.6 GB | ≤ +4.43 s |
| P5: 64K prompt, 1 request | 65,536 | 221.3 GB | ≤ +8.85 s |
| P6: 4 × 16K prompts, arriving together | 65,536 | 221.3 GB | ≤ +8.85 s |
For the tests with four requests, the bytes are those of all four prompts, and the time is that until the last of the four requests receives its first token.
5.3. From seconds to a percentage
As a share of TTFT, the bound becomes
TTFT increase ≤ network share × (B_old / B_new − 1), which is simply ≤ network share for 200 → 100 Gb/s,
where the network share is the time needed to send the prefill bytes at 200 Gb/s, divided by the prefill time.
The prefill time itself cannot be derived reliably from the architecture. A calculation from the number of arithmetic operations and the GB10’s peak compute would be off by an order of magnitude, because the real speed depends on how efficiently the engine’s kernels handle the MoE experts, attention and scheduling. The percentage therefore needs one measured input, the TTFT at 200 Gb/s, which Part II provides.
6. What Makes the Penalty Larger or Smaller
Since the penalty is at most the network share of prefill time, anything that raises that share raises the penalty.
6.1. Prompt length
Every prompt token costs the same 3.38 MB, so the bytes grow in proportion to the prompt. The matrix computation grows in proportion as well. Attention, which compares each token with the tokens before it, grows faster than the prompt in a model where every token attends to the whole context; there, the network share, and with it the percentage penalty, slowly falls for very long prompts. GLM-5.3 uses DeepSeek Sparse Attention (DSA), in which each token attends to a selected set of about 2,048 earlier tokens, so its computation stays close to proportional to the prompt and the percentage penalty should stay roughly constant for long prompts. In seconds, the penalty keeps growing with prompt length in either case.
Short prompts are different. A 1K-token prompt fits in one small prefill chunk, and each of its all-reduces sends only about 22 MB per Spark, under a millisecond at 200 Gb/s. Such short transfers may not reach the full link speed, and the fixed overhead of each forward pass weighs more, so the bound can overstate the effect.
6.2. Several requests at once
When several prompts arrive together, their prefill chunks share the forward passes. The bytes per prompt token stay the same, but the computation per token falls, because each prompt attends over a shorter context and the work runs in fuller batches. More of the time is spent communicating, so the penalty is larger than for one prompt of the same total length. The order in which the engine processes the prompts, and when the first of them start generating, also affects each request’s own TTFT.
6.3. TP size
Relative to TP8, the bytes per Spark per token and the computation per Spark change as follows:
| TP size | Bytes per Spark | Computation per Spark |
|---|---|---|
| TP2 | 0.57× | 4× |
| TP4 | 0.86× | 2× |
| TP8 | 1× | 1× |
| TP16 | 1.07× | 0.5× |
The network share, and with it the penalty, grows quickly with TP size: lower link speed is easiest to accept at low TP sizes and costs more as a model is spread across more Sparks. Section 10 puts numbers on this using the measured TP8 baseline.
Part II: Measurement
7. Test Design
7.1. Changing only the link
The comparison is useful only if the link speed is the single difference between the two configurations. The same model, engine, settings, prompts and test plan were used in both; only the network path changed.
7.2. Setup
| Item | Value |
|---|---|
| Systems | 8× NVIDIA DGX Spark (GB10, 128 GB unified memory), driver 580.173.02 |
| Switch | MikroTik CRS804, 400G QSFP-DD ports in 2 × 200G breakout |
| Model | GLM-5.3 NVFP4 (Inferact/GLM-5.3-NVFP4): 753B-parameter MoE, about 40B active per token; hidden dimension 6,144; 78 layers; DeepSeek Sparse Attention |
| Engine | vLLM 0.1.dev20133+gb5f995e73 (container vllm-node-b12x), PyTorch 2.13, NCCL 2.28.3, Ray |
| Parallelism | TP8: one model instance across all 8 Sparks |
| Key settings | prefill chunks of up to 4,096 tokens, FP8 KV cache, speculative decoding with MTP (4 draft tokens; the draft model is not split across Sparks, so it adds no network traffic), CUDA graphs, up to 8 concurrent requests |
GLM-5.3 is a large MoE model that needs all 8 Sparks, which is the case where the cluster network matters most.
7.3. Emulating 100 Gb/s
The 100 Gb/s case was emulated rather than built with new cables: NCCL was configured to use only one of the two network interfaces on every Spark (NCCL_IB_HCA excluding the second RDMA device). Nothing physical changes, so the cables, switch ports and every other setting stay the same, and relaunching the model without this setting restores 200 Gb/s. In every emulated run, the benchmark confirmed from the adapter’s counters that all traffic went over the one remaining interface.
One interface carries what its PCIe Gen5 ×4 link allows: 4 lanes × 32 GT/s, reduced by line encoding (128b/130b) to 126 Gb/s and by PCIe packet and flow-control overhead to about 111 Gb/s. Measured with ib_write_bw, one interface carries 109 Gb/s. The emulated link is therefore about 9% faster than a real 100 Gb/s link.
With B_new = 109 Gb/s instead of 100, the bound of Section 5.1 becomes
extra prefill time ≤ prefill bytes × (1/109 − 1/200), about 0.11 s per 1,000 prompt tokens for GLM-5.3 at TP8
| Test | Estimate, 200 → 100 Gb/s (Section 5.2) | Estimate, 200 → 109 Gb/s (this experiment) |
|---|---|---|
| P1: 1K | ≤ +0.14 s | ≤ +0.12 s |
| P2: 8K | ≤ +1.11 s | ≤ +0.92 s |
| P3: 32K | ≤ +4.43 s | ≤ +3.69 s |
| P4: 4 × 8K | ≤ +4.43 s | ≤ +3.69 s |
| P5: 64K | ≤ +8.85 s | ≤ +7.39 s |
| P6: 4 × 16K | ≤ +8.85 s | ≤ +7.39 s |
Section 9 converts the measured results back to a real 100 Gb/s cable.
7.4. Test plan
| Test | Requests | Prompt → output tokens | Purpose |
|---|---|---|---|
| P1 | 1 | 1,024 → 1,024 | a short prompt, with small transfers |
| P2 | 1 | 8,192 → 1,024 | a typical long prompt |
| P3 | 1 | 32,768 → 1,024 | a long document |
| P4 | 4, arriving together | 4 × 8,192 → 1,024 | several requests, same total prompt size as P3 |
| P5 | 1 | 65,536 → 1,024 | a very long prompt |
| P6 | 4, arriving together | 4 × 16,384 → 1,024 | several requests, same total prompt size as P5 |
Each test ran one warm-up round, which is not counted, and three measured rounds. The output was fixed at exactly 1,024 tokens, so every request did the same amount of decoding and decode speeds are directly comparable.
7.5. What was measured
- TTFT (time to first token): the time from sending a request to receiving its first token. For P4 and P6, the time until the last of the four requests receives its first token is also reported; it covers all four prompts’ bytes and is the quantity the estimate describes.
- Decode speed: how fast the answer streams, in tokens per second after the first token: (output tokens − 1) ÷ (time of the last token − time of the first token). A tokens-per-second figure that divides by the whole request time, TTFT included, is not used for decode comparisons, because it falls with long prompts even when decode speed does not change.
- Network traffic: bytes and rates from the RDMA counters of one Spark’s ConnectX-7 (Appendix A). Under a ring all-reduce every Spark sends the same amount, so one Spark represents all eight.
7.6. Keeping the runs comparable
Prompts were taken from a fixed prompt set and padded to the target length with a fixed random seed, so both configurations received identical prompts. Each request’s padding was ordered differently, so the engine could not reuse work cached from an earlier request. Services not needed for the test were stopped on all Sparks, and each run started only after the link had carried no traffic for 10 seconds. Requests and traffic samples were timestamped on the same Spark and clock, so the traffic of each request’s prefill and decode can be separated exactly.
All measured rounds are used and reported as means, with the range across rounds. The rounds were consistent: within a test, prefill times varied by at most 0.6 s for single requests and 1.2 s for four requests.
8. Results: 200 Gb/s vs Emulated 100 Gb/s at TP8
8.1. How much of the 200 Gb/s the cluster uses
Figure 4 shows the traffic one Spark sends during one 8K-token request on the 200 Gb/s cluster. During prefill, bursts of a few milliseconds near full link speed alternate with gaps in which the Sparks compute, as Section 4.1 describes; in the 200 ms zoom, each burst is one prefill all-reduce. After the first token, decode traffic is low and steady.
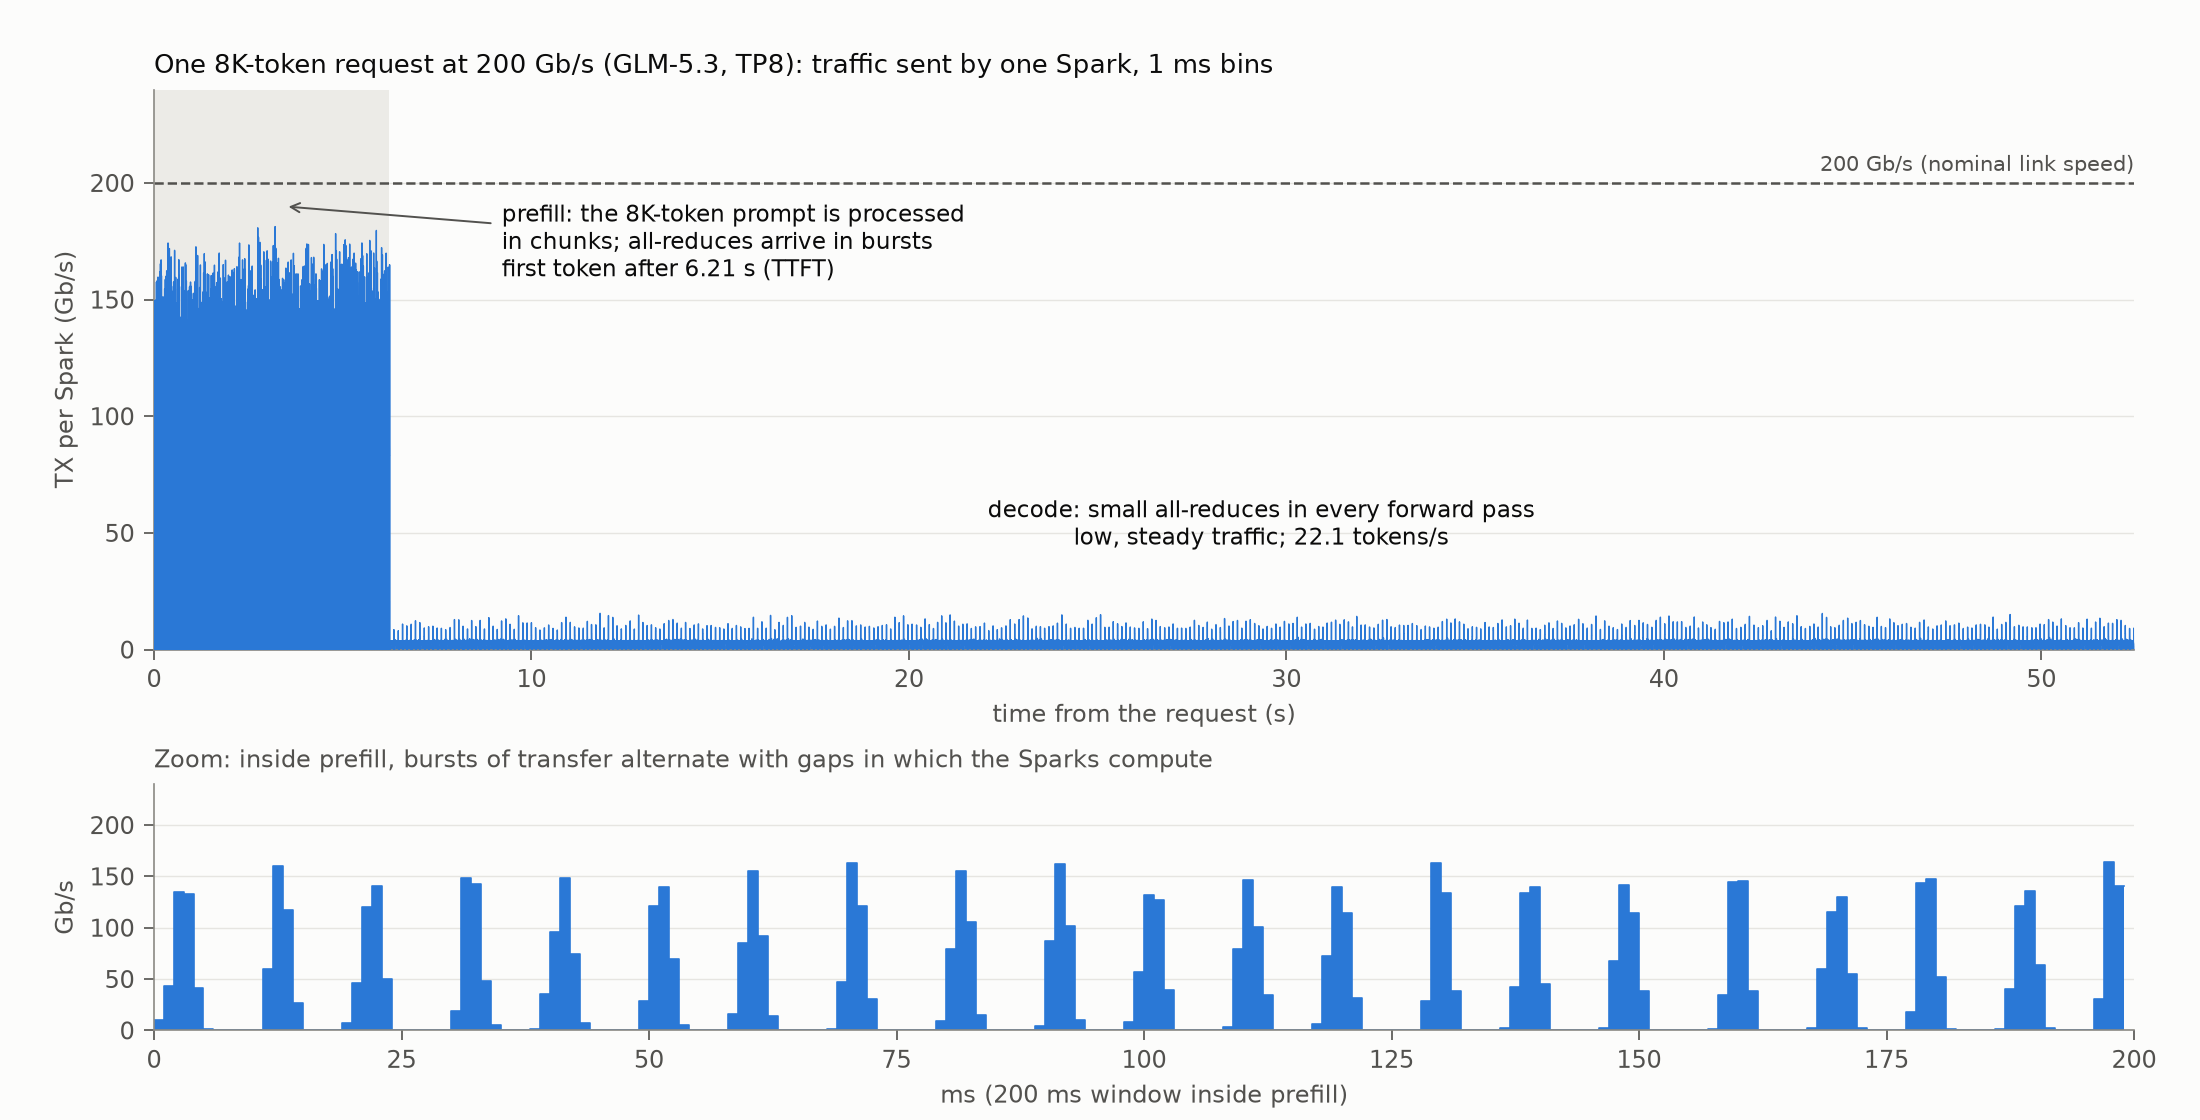
Figure 4: One 8K-token request at 200 Gb/s, traffic sent by one Spark in 1 ms intervals; below, a 200 ms window inside prefill.
Measured in 1 ms intervals, the bursts of single 8K–64K prompts reach about 150–180 Gb/s, and those of four prompts arriving together close to 200 Gb/s. Averaged over a whole 8K prefill, however, the traffic is 37 Gb/s, because the link carries nothing while the Sparks compute. Decode averages about 3 Gb/s for one request and about 6 Gb/s for four, within the limits estimated in Section 4.2. The cluster uses the full 200 Gb/s, but only for a few milliseconds at a time.
The averaging interval decides which of these two pictures a measurement shows. The same 8K prefill gives these highest values:
| Averaging interval | Highest value |
|---|---|
| 1 ms | 181 Gb/s |
| 5 ms | 96 Gb/s |
| 100 ms | 44 Gb/s |
| 1 s | 40 Gb/s |
| whole prefill (average) | 37 Gb/s |
A switch that reports one-second averages would show about 40 Gb/s and suggest a nearly idle link. The bursts that determine TTFT are only visible at millisecond resolution (Appendix A).
8.2. The traffic in each test
Figures 5–10 show the traffic one Spark sends during the three measured rounds of each test, with 200 Gb/s on top and the emulated 100 Gb/s below, on the same time axis. The grey band is prefill, ending at the first token.
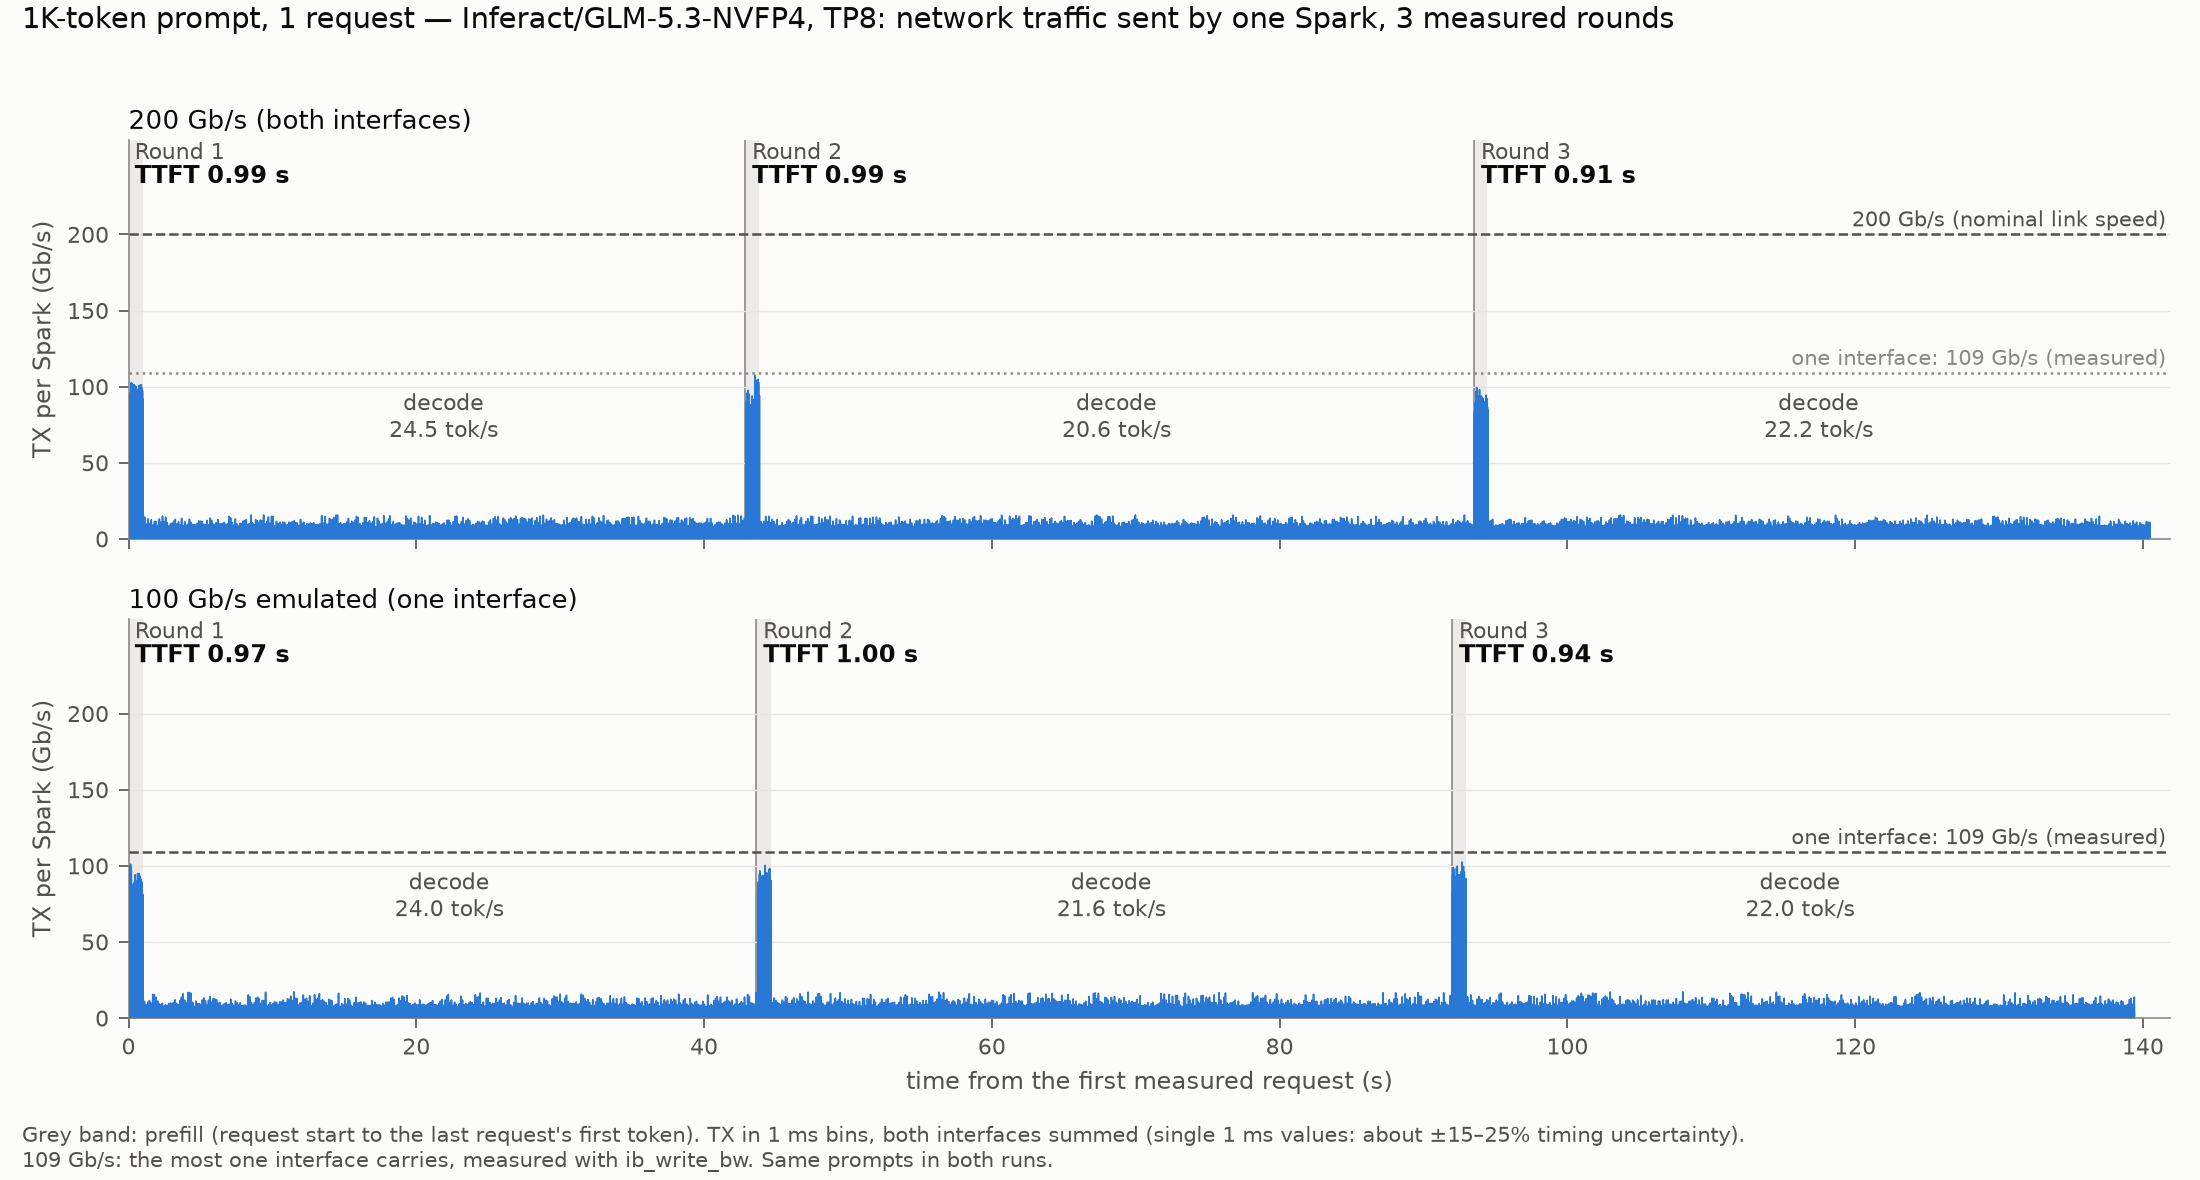
Figure 5: P1, 1K-token prompt, 1 request.
With a 1K prompt, the prefill bursts reach only about 100 Gb/s even on the 200 Gb/s cluster, below what one interface can carry, so the emulated link does not slow them down. TTFT is the same at both link speeds: 0.96 s and 0.97 s.
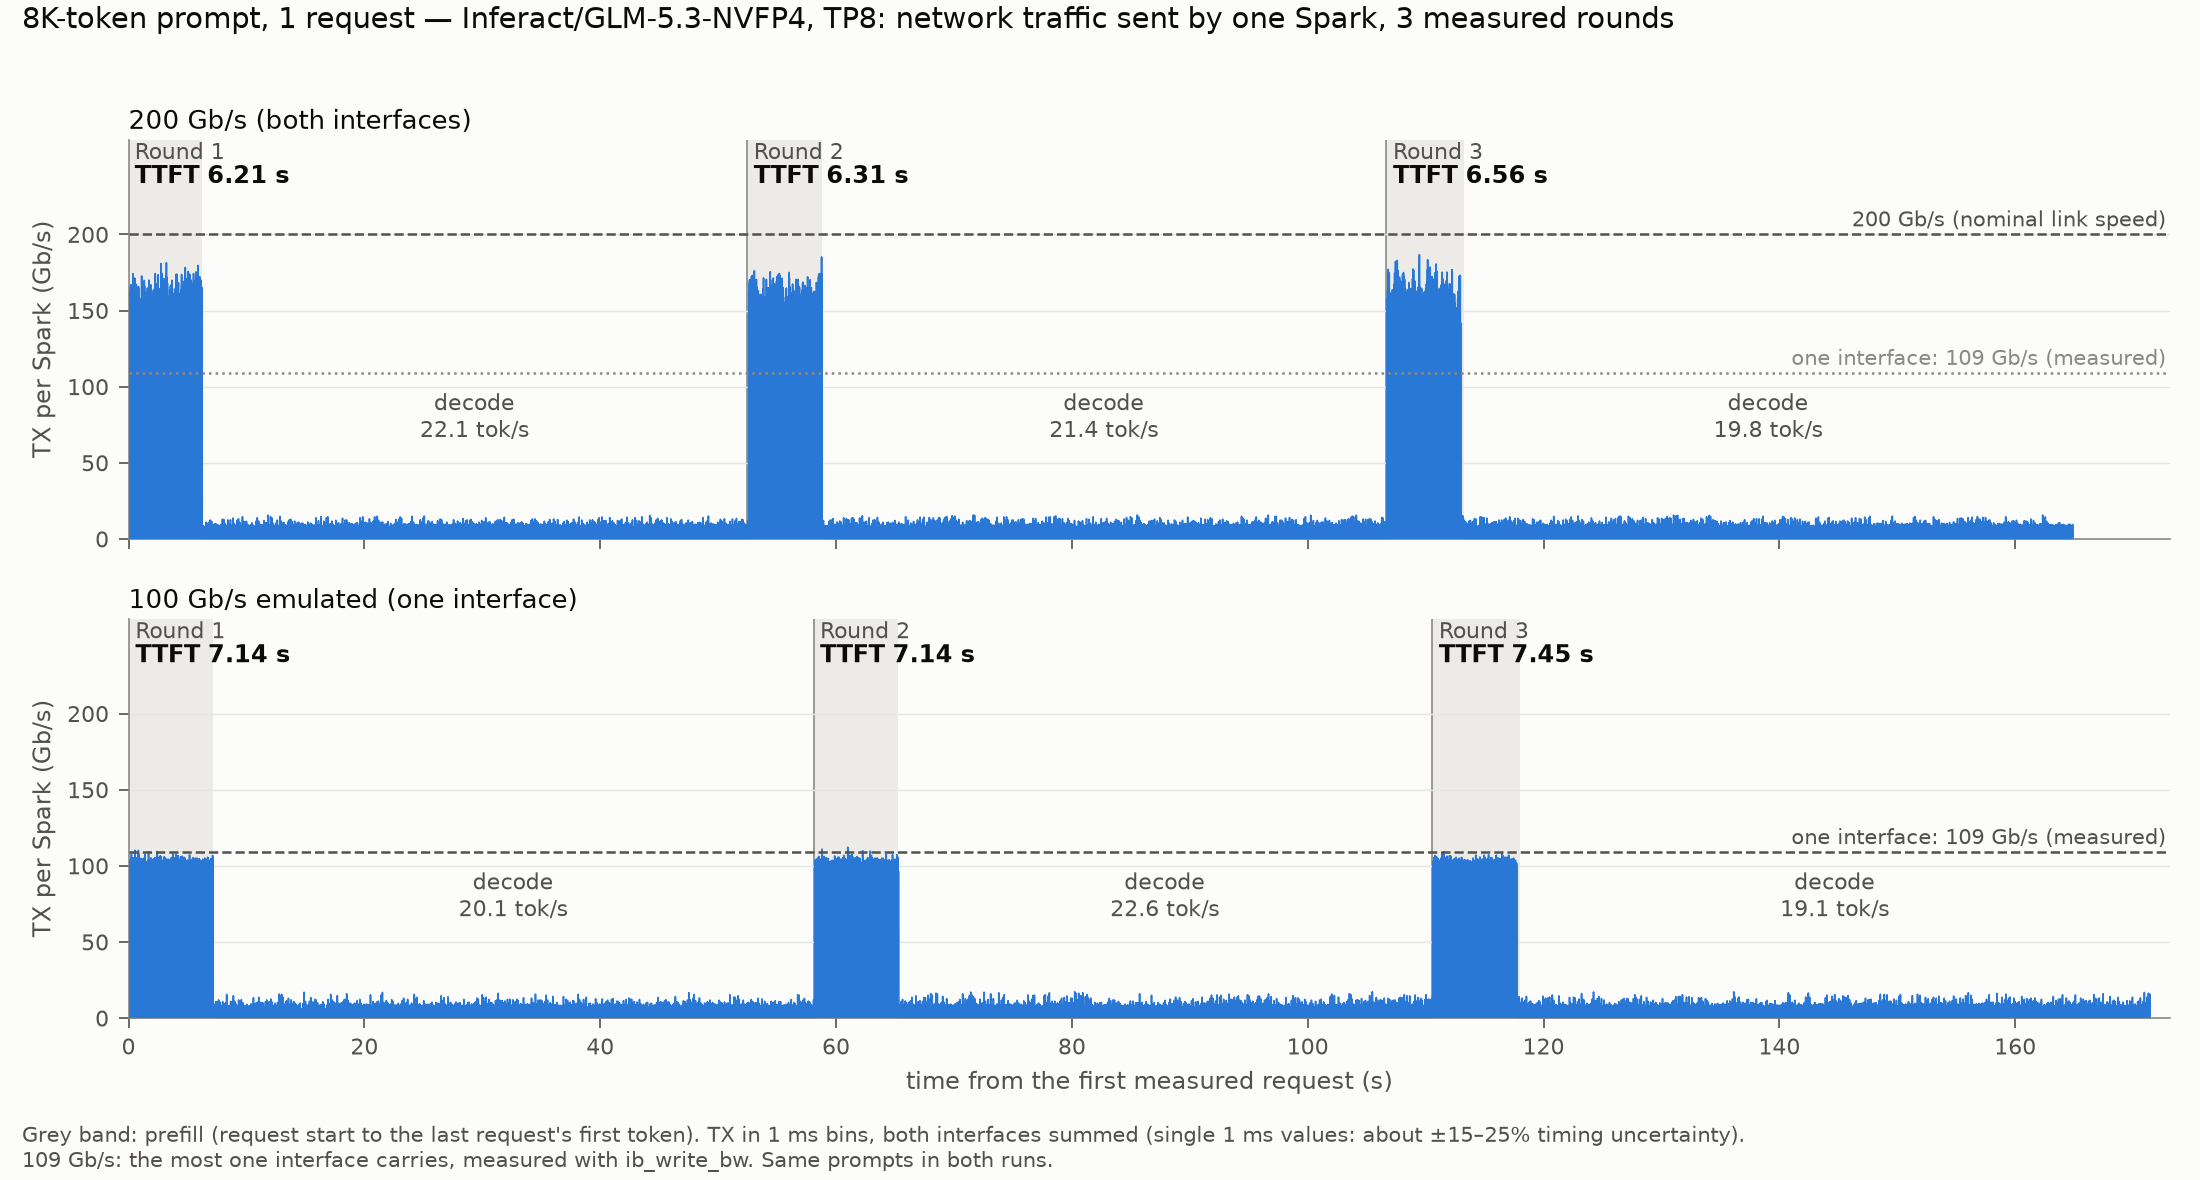
Figure 6: P2, 8K-token prompt, 1 request.
With an 8K prompt, prefill runs at about 150–180 Gb/s at 200 Gb/s. On the emulated link the same bursts are held at about 105–109 Gb/s and take longer, and TTFT grows from 6.36 s to 7.24 s. Decode traffic looks the same in both panels.
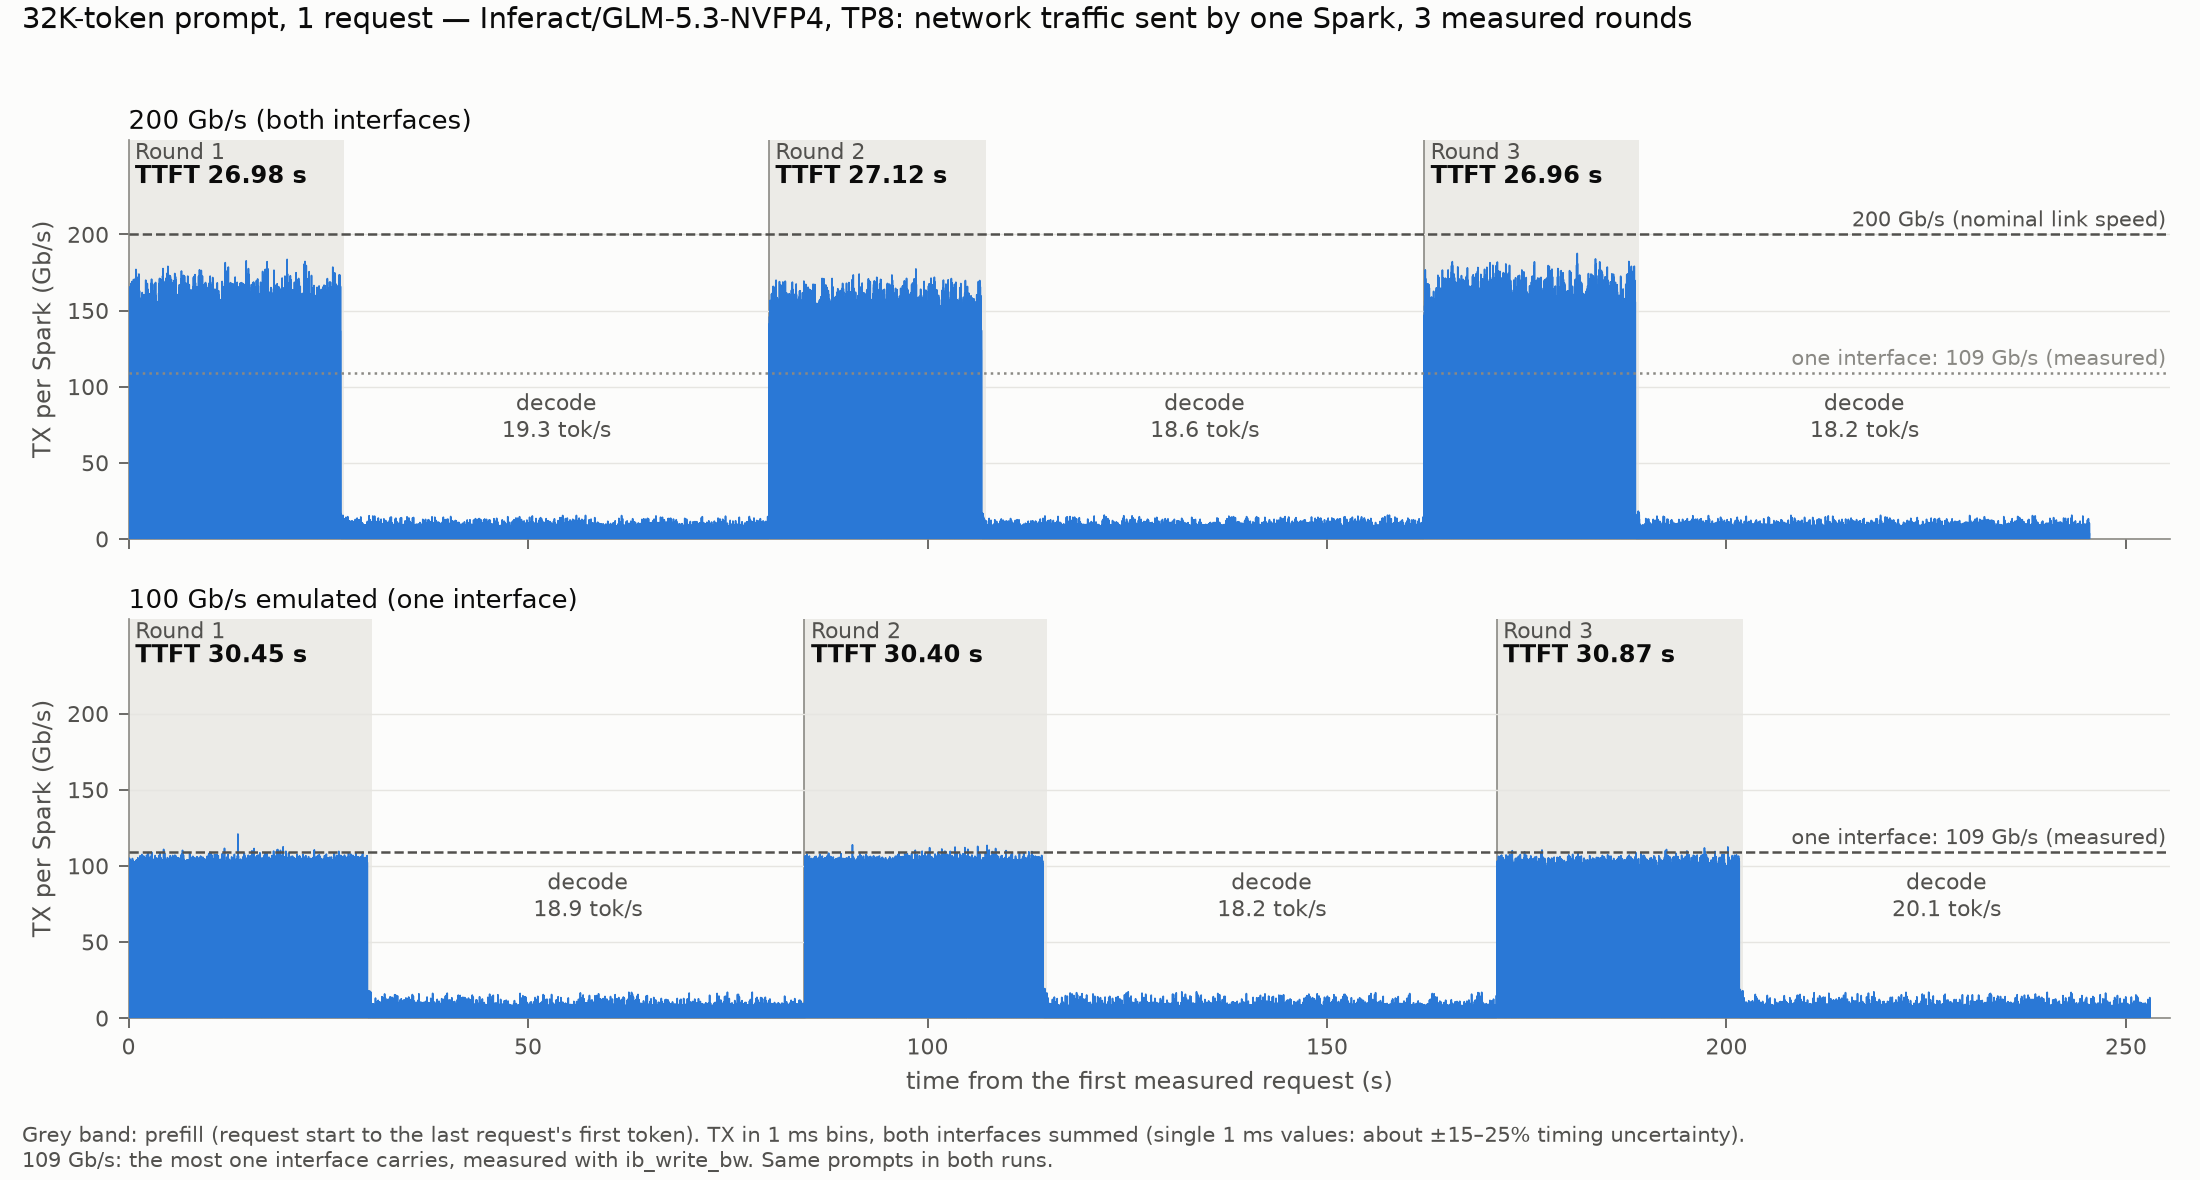
Figure 7: P3, 32K-token prompt, 1 request.
The 32K prompt shows the same pattern over a longer prefill, with TTFT growing from 27.0 s to 30.6 s.
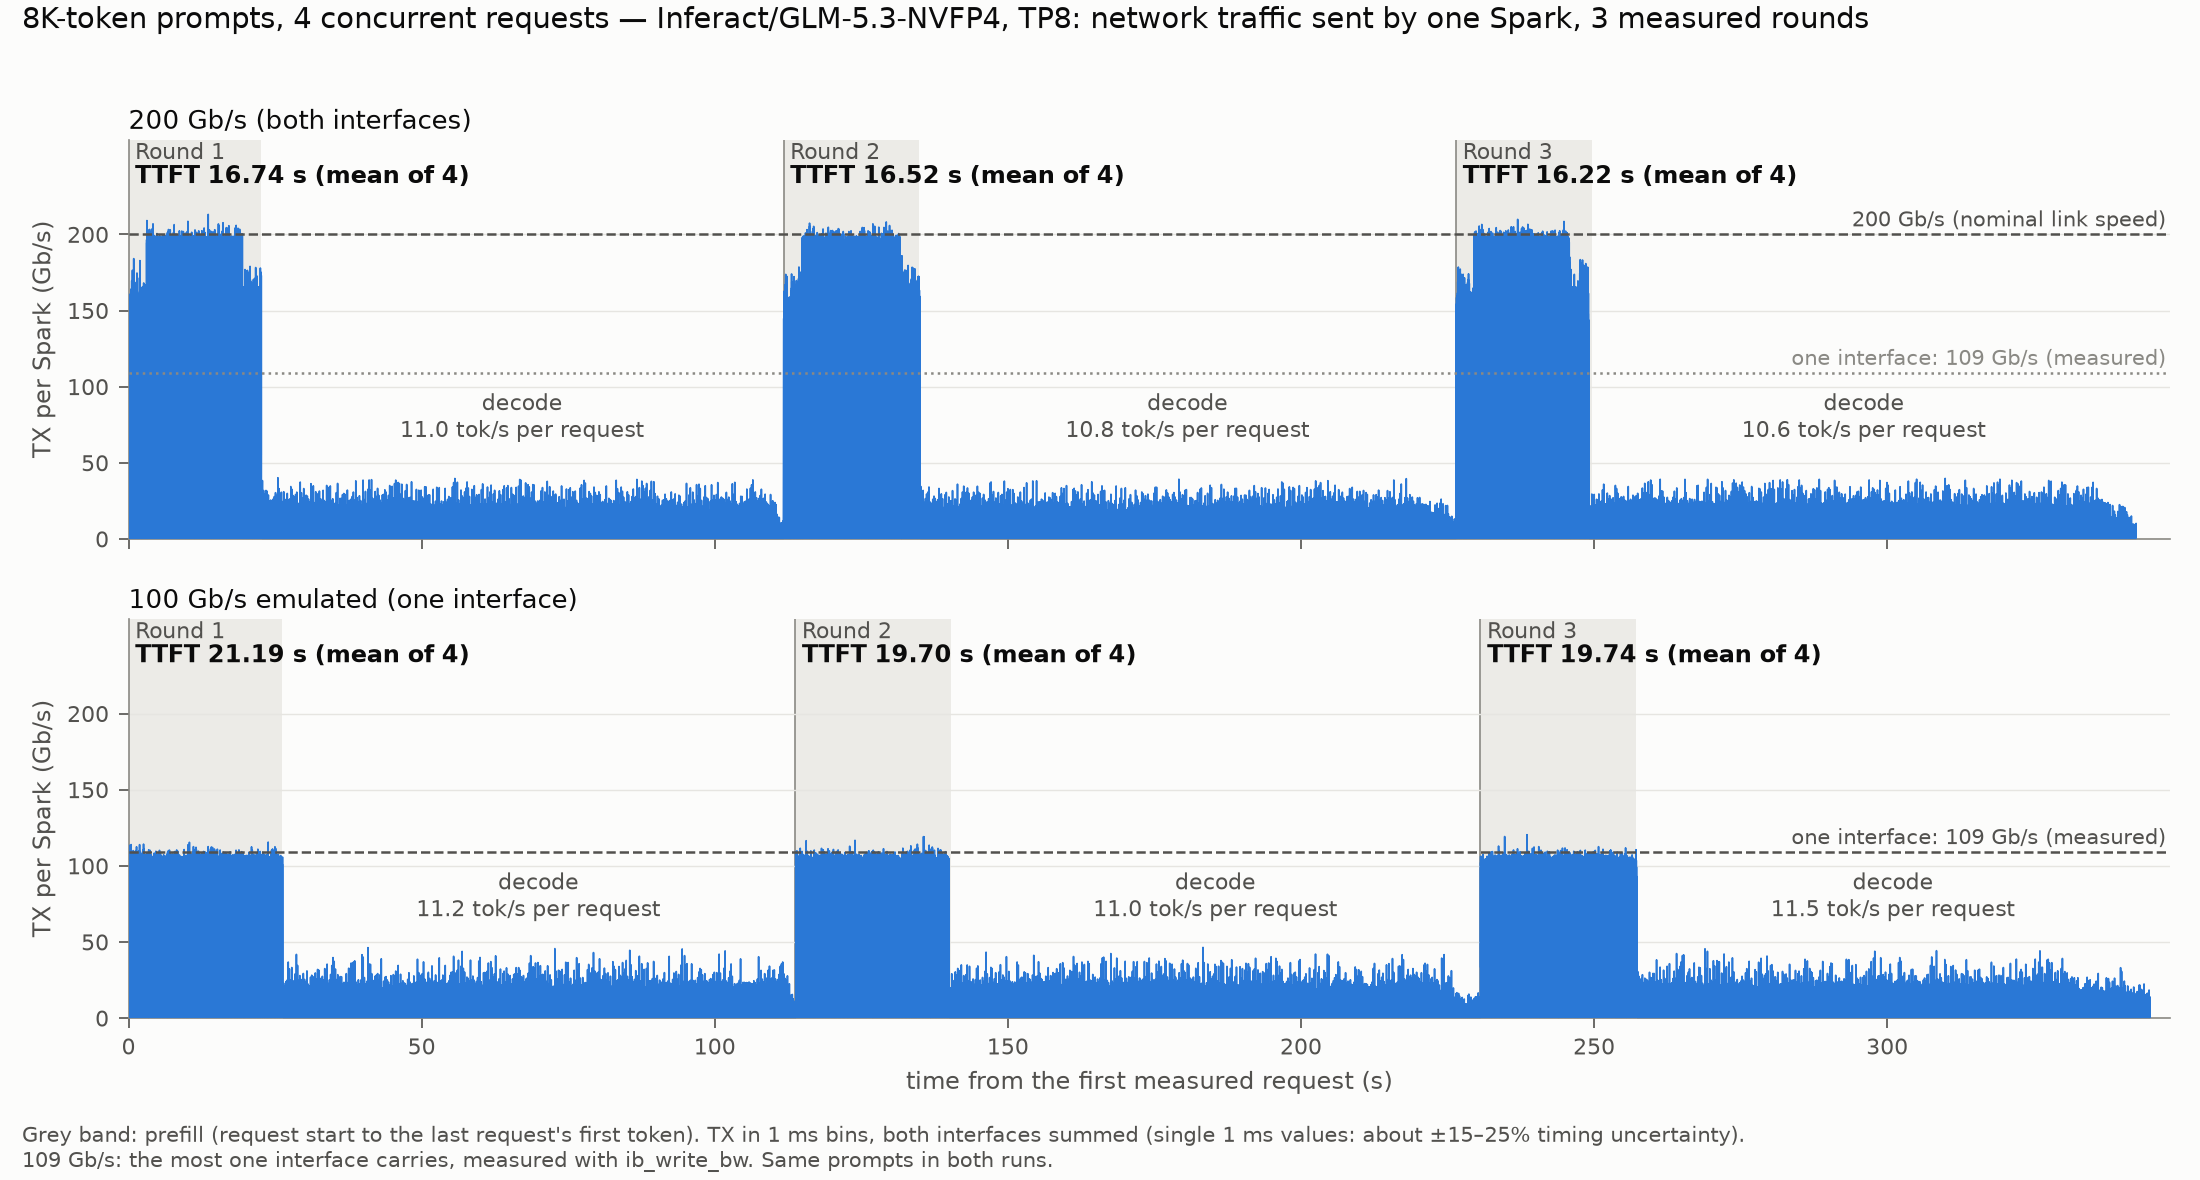
Figure 8: P4, four 8K-token prompts arriving together.
With four prompts arriving together, prefill keeps the 200 Gb/s link close to fully used, while the emulated link stays at 109 Gb/s throughout. The time until the last first token grows from 23.0 s to 26.4 s. Decode traffic is higher with four requests, but still far below either link speed.
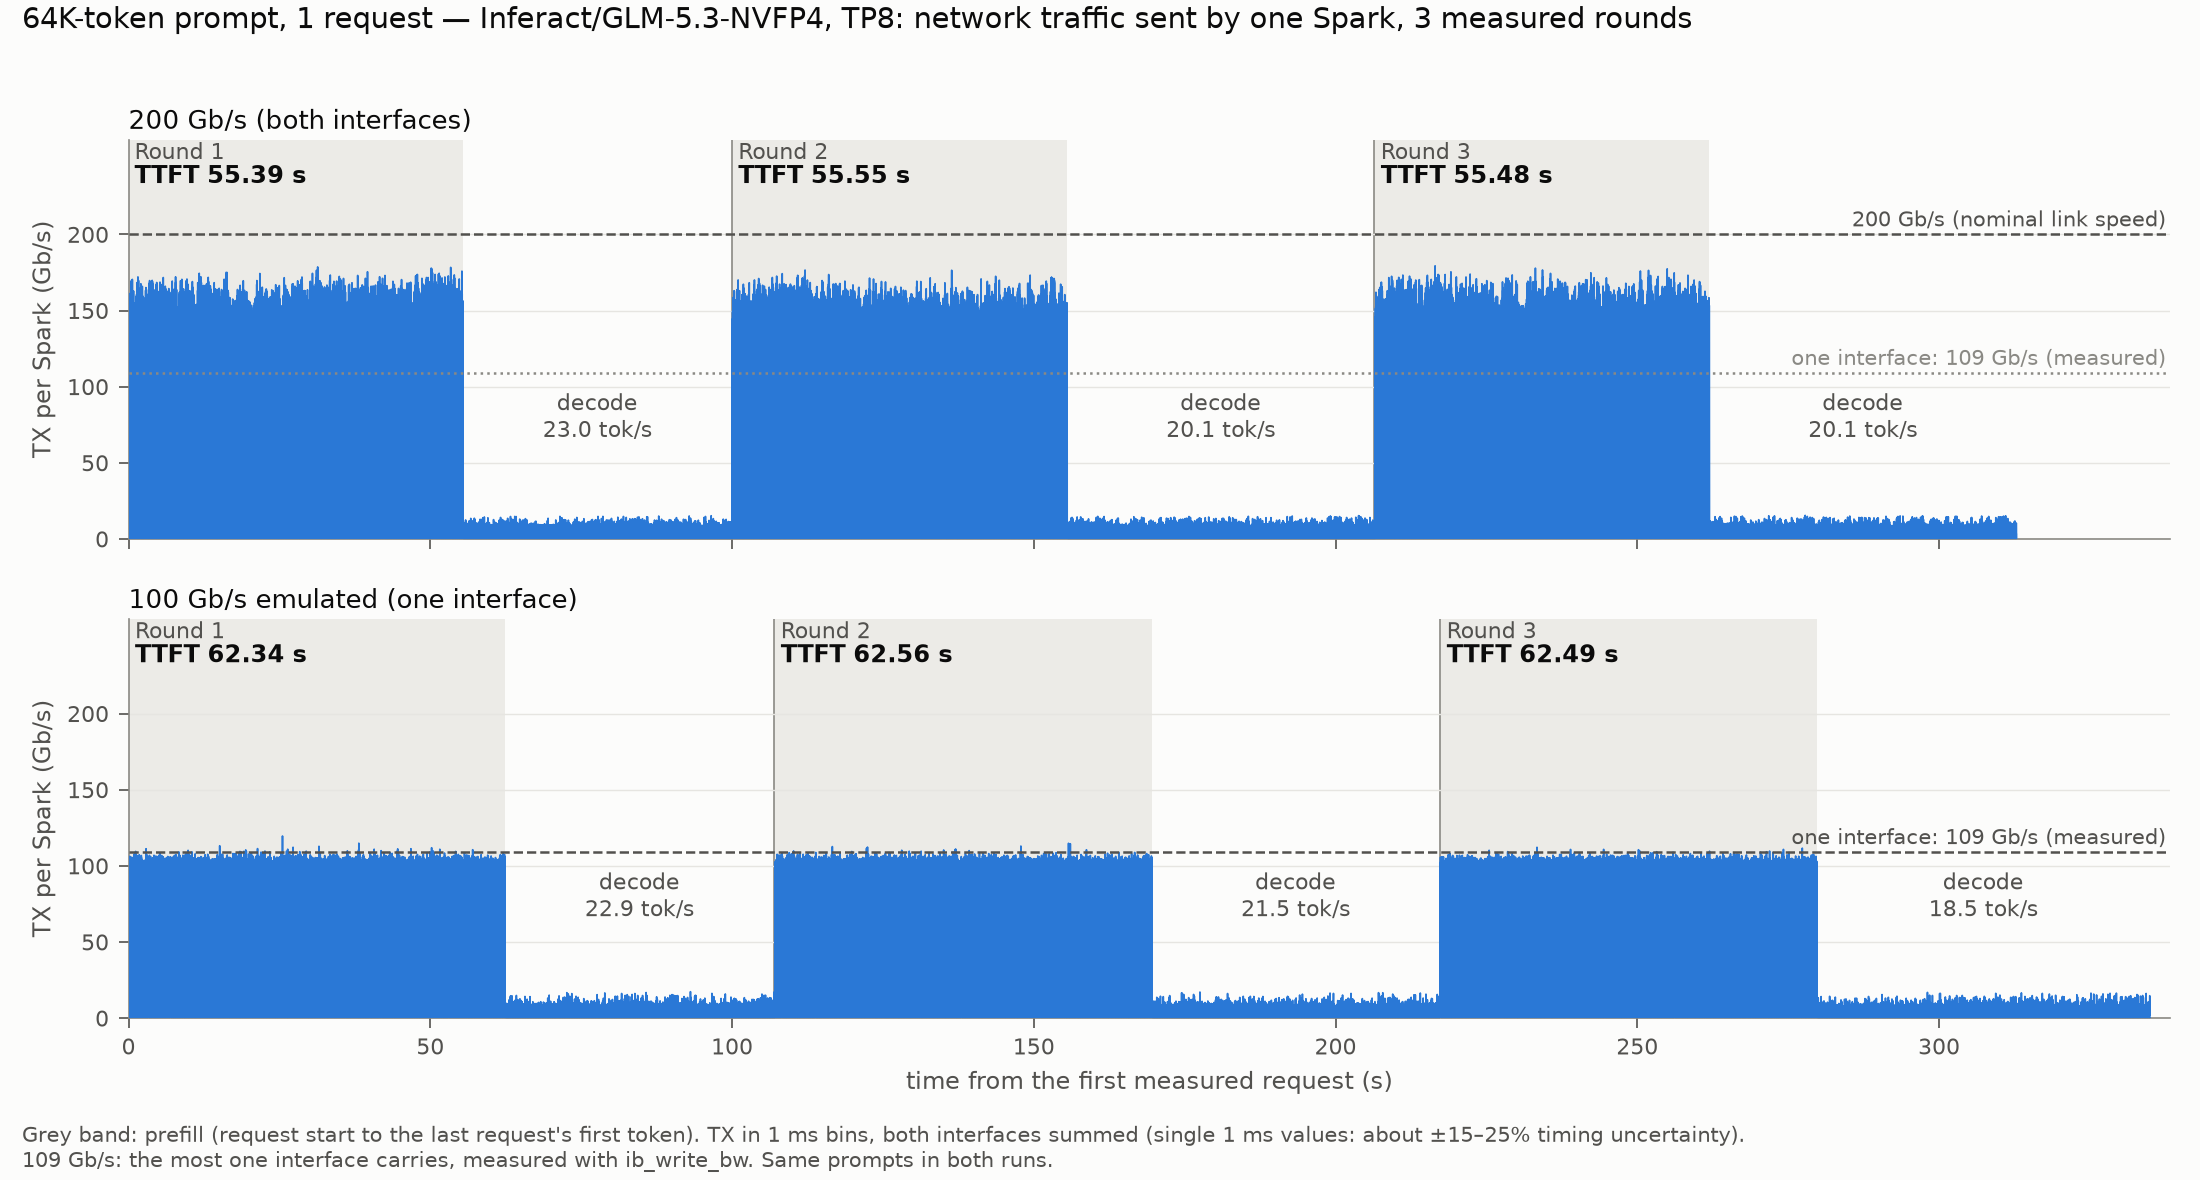
Figure 9: P5, 64K-token prompt, 1 request.
The 64K prompt behaves like the 32K prompt over twice the length: bursts of about 150–180 Gb/s at 200 Gb/s, held at 109 Gb/s on the emulated link, and TTFT growing from 55.5 s to 62.5 s. The three rounds agree within 0.2 s.
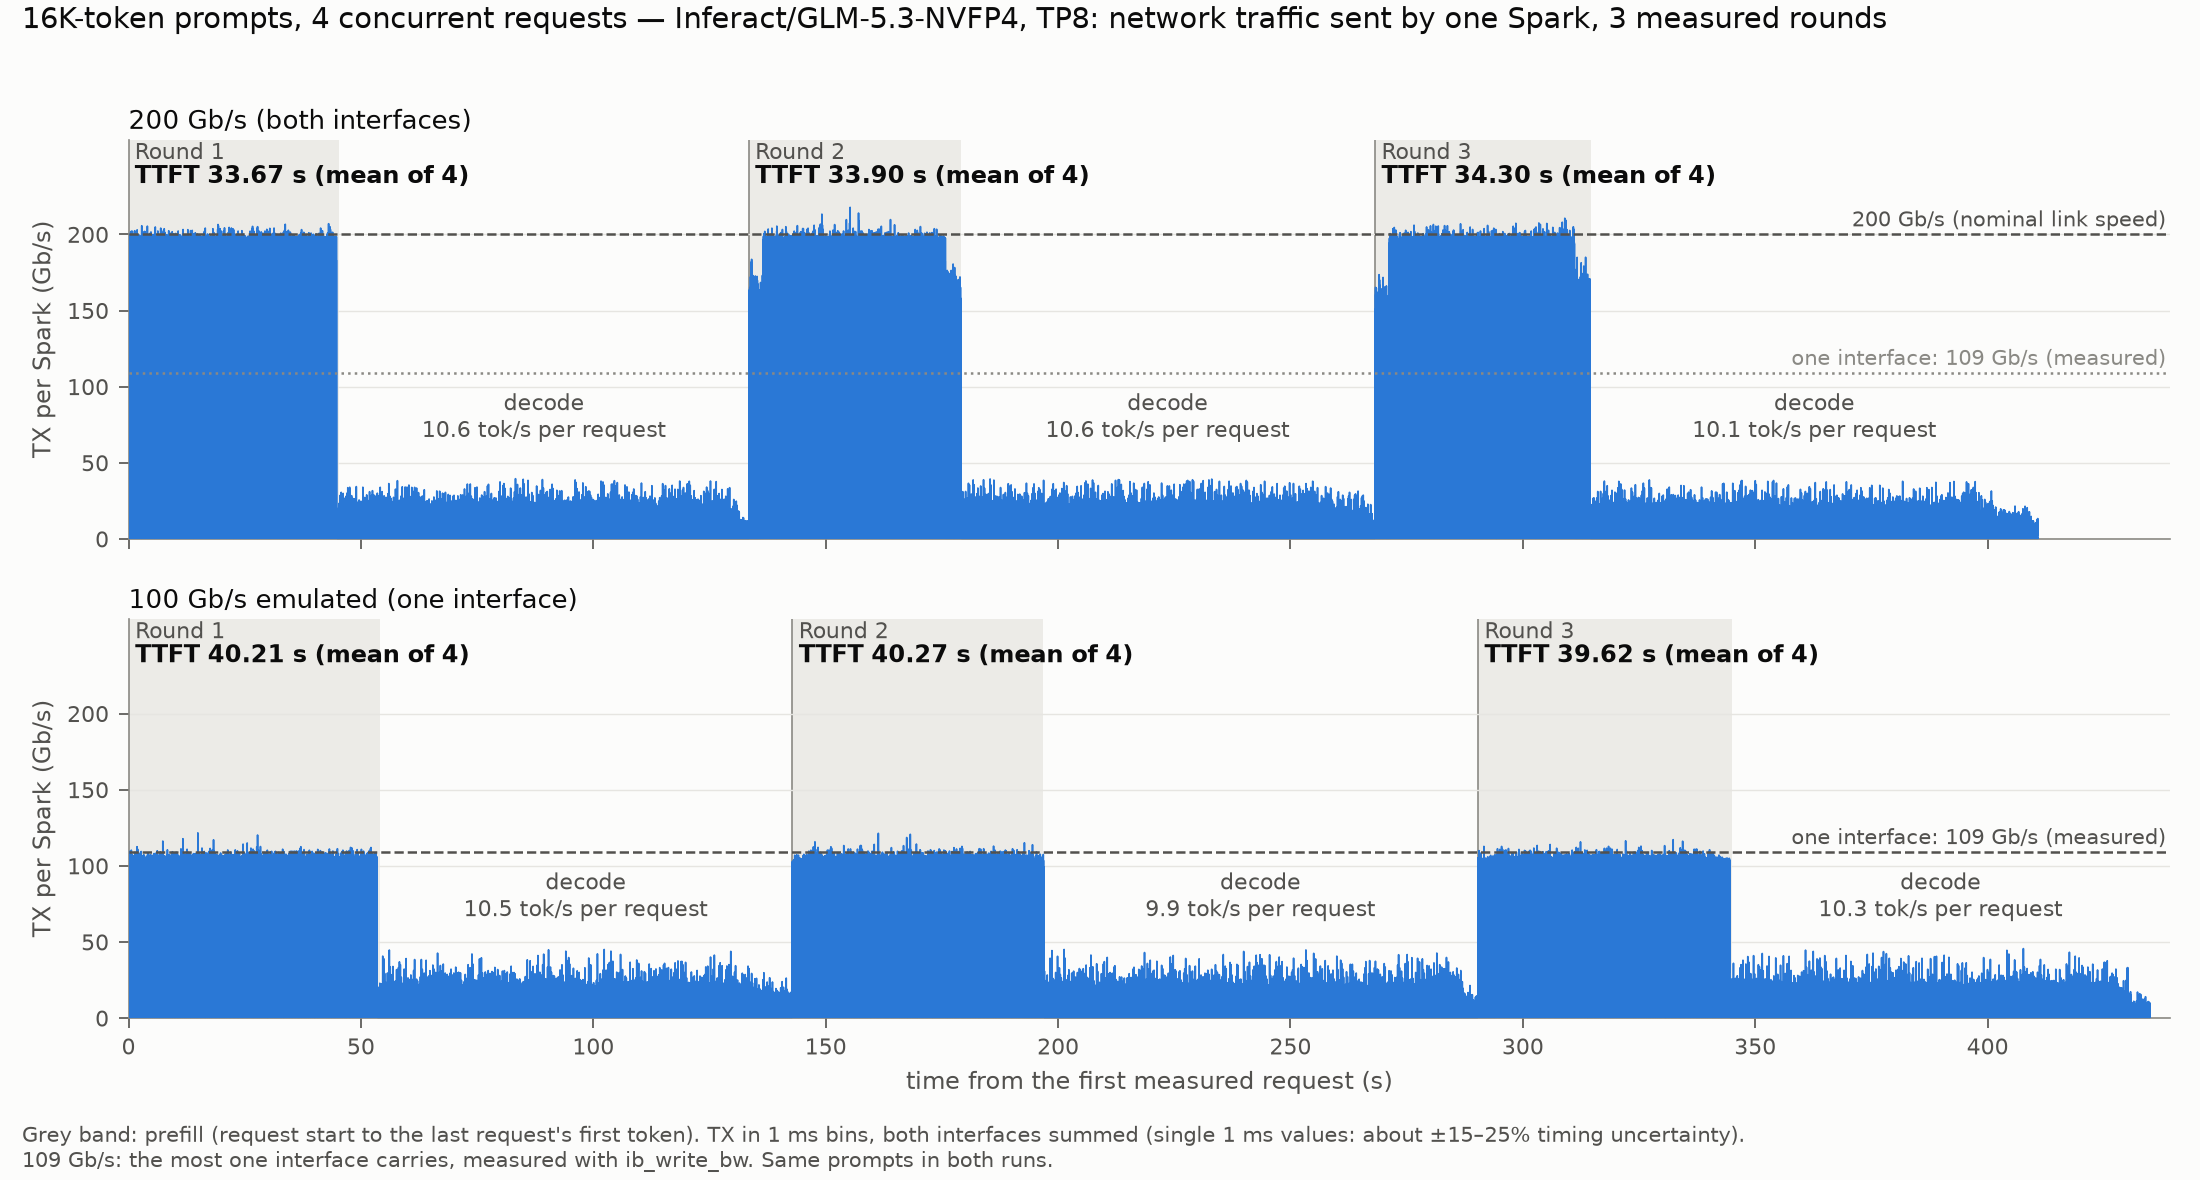
Figure 10: P6, four 16K-token prompts arriving together.
With four 16K prompts, prefill keeps the 200 Gb/s link close to fully used for about 46 s, against about 54 s at 109 Gb/s on the emulated link. The engine processes the four prompts in pairs: the first two receive their first tokens at about 22 s (200 Gb/s) and 27 s (emulated), the last two at about 45 s and 54 s. While the second pair is still in prefill, the first pair is already decoding.
8.3. Traffic per prompt token
The measured prefill traffic was 3.54–3.60 MB per prompt token per Spark, 5–7% more than the 3.38 MB of Section 3.3. The difference is the headers of the network packets and a small amount of traffic per request. The bytes were the same at both link speeds, which confirms that only the link speed changed.
8.4. TTFT
Means of three rounds, with the range across rounds in brackets; for P4 and P6, the time until the last of the four requests receives its first token. The estimate for the emulated link (Section 7.3) is given for comparison.
| Test | 200 Gb/s | 100 Gb/s (emulated, 109 Gb/s) | Increase |
|---|---|---|---|
| P1: 1K | 0.96 s (0.91–0.99) | 0.97 s (0.94–1.00) | +0.01 s (+1.1%), no measurable difference (estimate: ≤ +0.12 s) |
| P2: 8K | 6.36 s (6.21–6.56) | 7.24 s (7.14–7.45) | +0.88 s (+13.9%) (estimate: ≤ +0.92 s) |
| P3: 32K | 27.02 s (26.96–27.12) | 30.57 s (30.40–30.87) | +3.55 s (+13.1%) (estimate: ≤ +3.69 s) |
| P4: 4 × 8K, last first token | 23.00 s (22.61–23.19) | 26.44 s (26.20–26.59) | +3.44 s (+15.0%) (estimate: ≤ +3.69 s) |
| P5: 64K | 55.47 s (55.39–55.55) | 62.47 s (62.34–62.56) | +6.99 s (+12.6%) (estimate: ≤ +7.39 s) |
| P6: 4 × 16K, last first token | 45.82 s (45.36–46.52) | 54.26 s (54.08–54.60) | +8.44 s (+18.4%) (estimate: ≤ +7.39 s) |
Averaged over the four requests of each round, TTFT grew from 16.49 s to 20.21 s in P4 (+22.5%) and from 33.96 s to 40.03 s in P6 (+17.9%). These are the largest increases measured in any test.
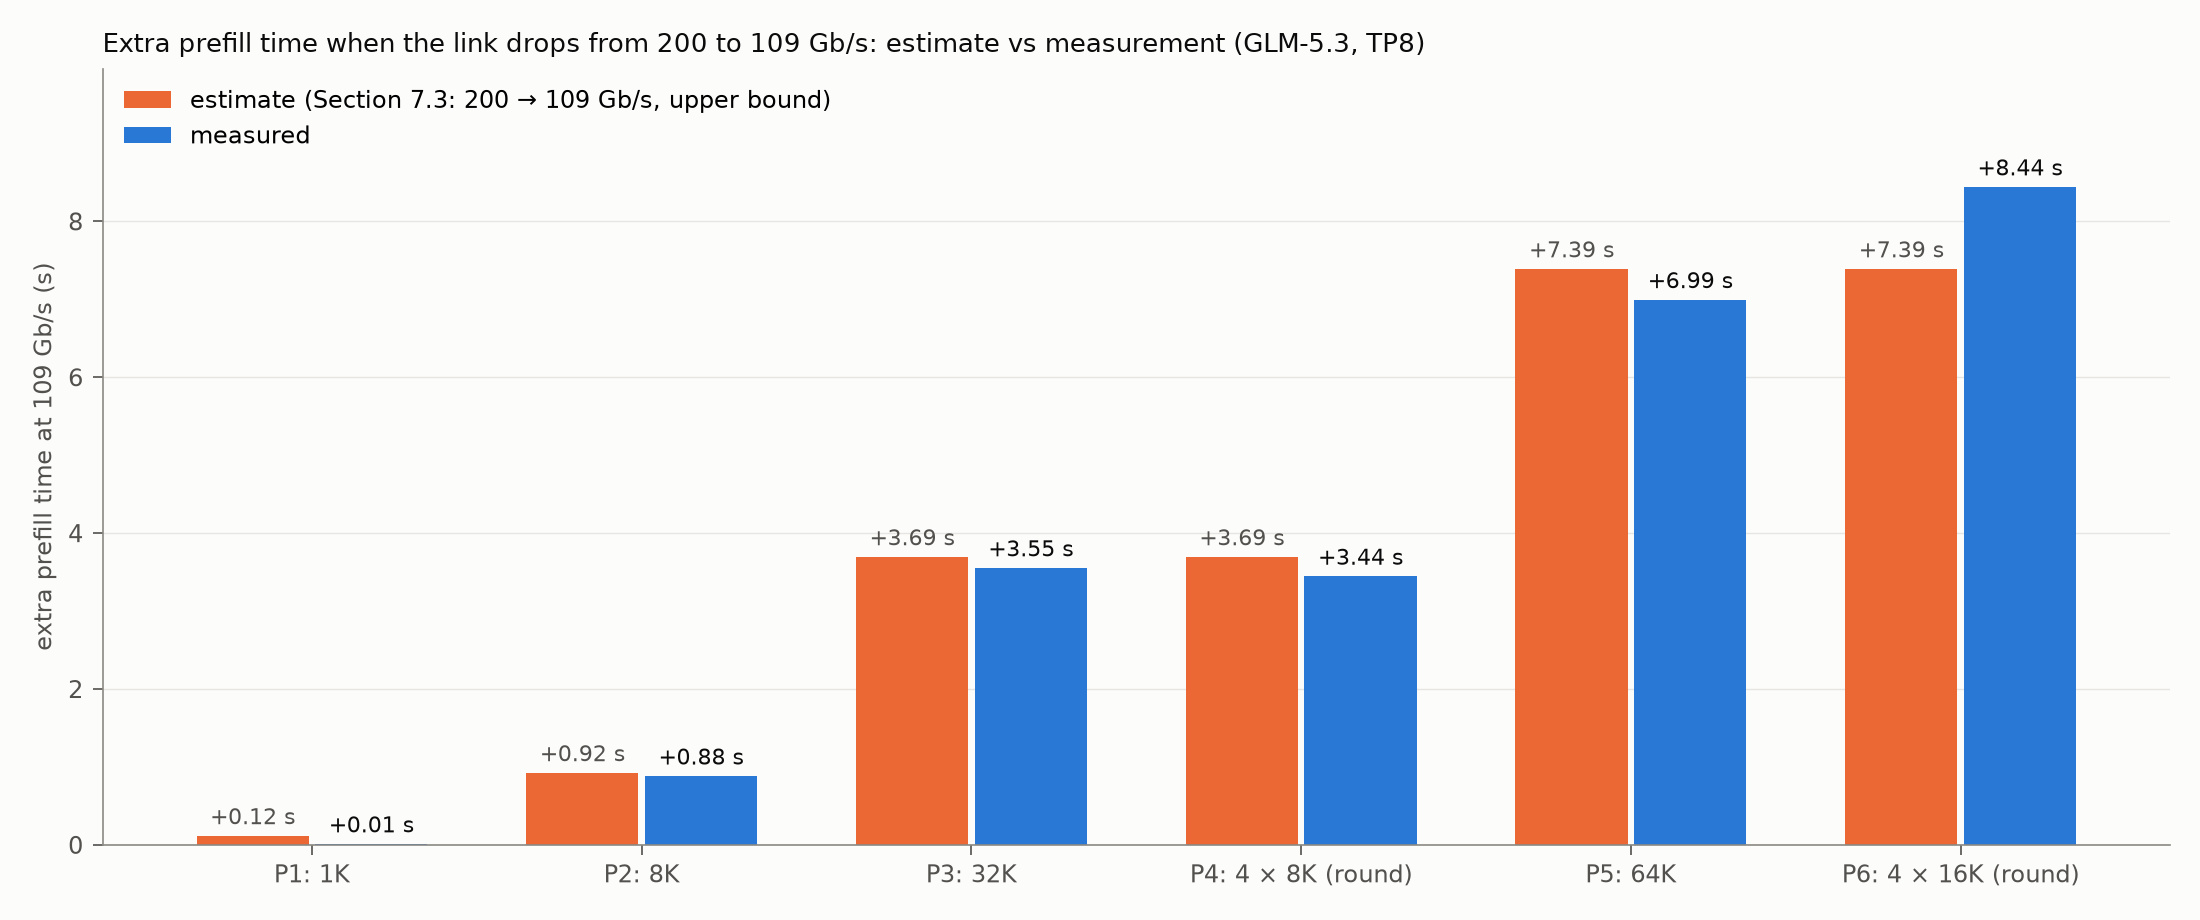
Figure 11: Extra prefill time when the link drops from 200 to 109 Gb/s: estimate (Section 7.3) against measurement.
For single prompts of 8K–64K tokens and for four 8K prompts arriving together, the measured increase came within a few percent of the estimate, slightly below it, as expected of an upper bound: a small part of the transfers overlaps with computation. The estimate from the model’s architecture, the engine’s prefill chunk size and the link speed therefore predicts the effect of a slower link well, without any measurement of the computation. In seconds, the increase is about 0.11 s per 1,000 prompt tokens.
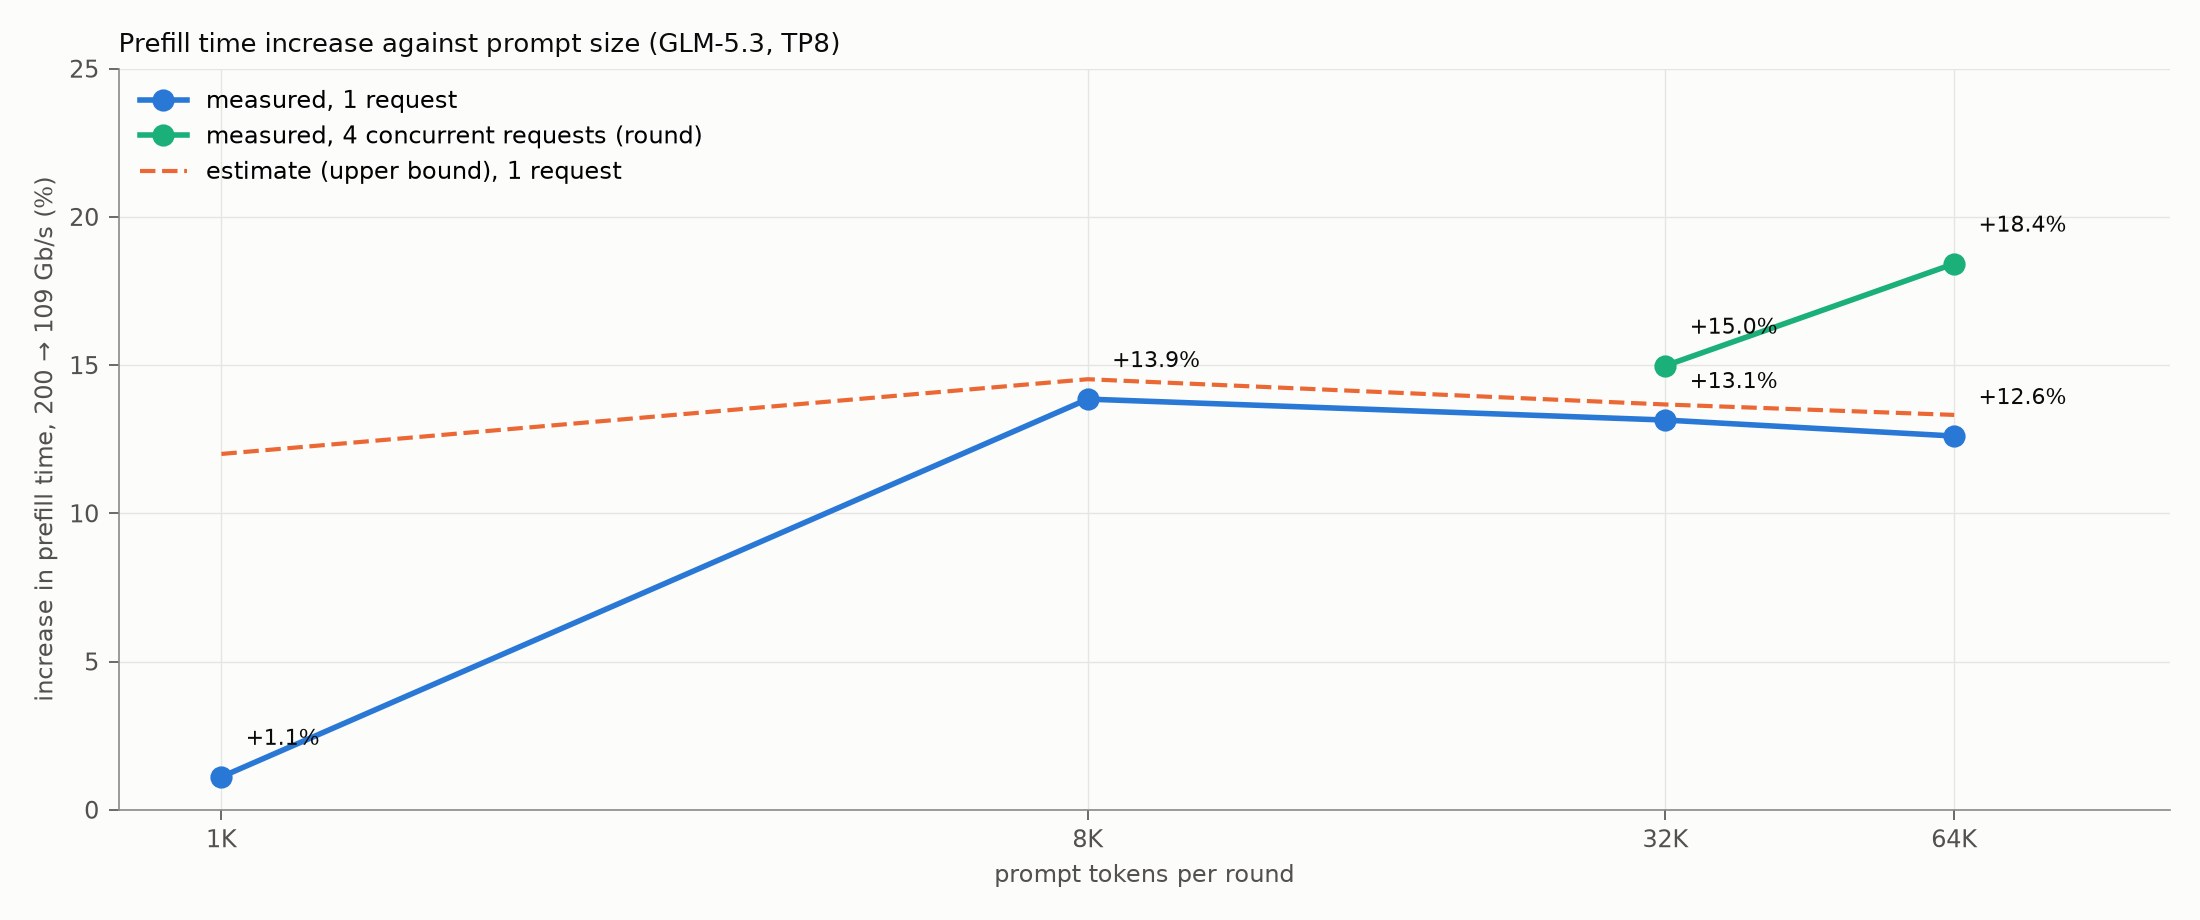
Figure 12: Increase in prefill time against prompt size, measured and estimated.
For a single prompt, the percentage stays nearly constant from 8K to 64K tokens (13.9%, 13.1% and 12.6%), as Section 6.1 expects for a model with sparse attention; the slight decline is the part of the attention work that still grows faster than the bytes. With several prompts arriving together, the percentage is higher for the same total prompt size, 15.0% for four 8K prompts and 18.4% for four 16K prompts, as Section 6.2 expects.
8.5. Decode speed
| Test | 200 Gb/s | 100 Gb/s (emulated) | Change |
|---|---|---|---|
| P1: 1K | 22.4 tokens/s | 22.5 tokens/s | +0.5% |
| P2: 8K | 21.1 tokens/s | 20.6 tokens/s | −2.3% |
| P3: 32K | 18.7 tokens/s | 19.1 tokens/s | +2.0% |
| P4: 4 × 8K | 10.8 tokens/s per request | 11.2 tokens/s per request | +4.3% |
| P5: 64K | 21.1 tokens/s | 21.0 tokens/s | −0.4% |
| P6: 4 × 16K | 10.5 tokens/s per request | 10.2 tokens/s per request | −2.1% |
The changes point in both directions and stay within the variation between rounds: decode speed does not depend on the link speed, as Section 4.2 expects.
8.6. Where the measurement departs from the estimate
The 1K prompt. The estimate allows up to +0.12 s, and the measurement shows +0.01 s. Each all-reduce of a 1K prompt sends only about 22 MB per Spark, and the bursts reach only about 100 Gb/s even at 200 Gb/s (Figure 5), below what the emulated link carries. As Section 6.1 anticipates, the bound overstates the effect for short prompts.
Four 16K prompts arriving together. Here the measured increase exceeds the estimate by about 1 s. The estimate covers the time spent sending bytes. In this test the engine processed the prompts in pairs and started decoding the first pair while the second pair was still in prefill (Section 8.2), so decode work shared the forward passes of the remaining prefill. The longer that prefill takes, the more decode work falls inside it, and the time until the last first token grows by more than the extra transfer time alone. This effect of the engine’s scheduling lies outside the estimate, and it can raise the penalty when several long prompts arrive together.
Four 8K prompts arriving together. The time until the last first token stayed within the estimate, but the order in which the engine released the four first tokens differed between the two link speeds. The TTFT of individual requests in such tests therefore depends partly on scheduling, not only on the link.
9. From the Emulated Link to a Real 100G Cable
The emulated link carries up to 109 Gb/s; a real 100 Gb/s link carries at most 100. Applying the bound to this difference gives the most a real cable can add to the measured results:
additional prefill time ≤ measured prefill bytes × (1/100 − 1/109)
| Test | Emulated 100 Gb/s (measured) | Real 100 Gb/s cable, at most |
|---|---|---|
| P1: 1K | +1.1% | +3.6% |
| P2: 8K | +13.9% | +16.9% |
| P3: 32K | +13.1% | +16.0% |
| P4: 4 × 8K, last first token | +15.0% | +18.3% |
| P5: 64K | +12.6% | +15.4% |
| P6: 4 × 16K, last first token | +18.4% | +21.8% |
A real 100 Gb/s cable would therefore be at most 2.5–3.5 percentage points worse than the measured results, and decode speed would still be unaffected. In seconds, Section 5.1 gives at most 0.135 s per 1,000 prompt tokens. A real 100 Gb/s link carries slightly less than 100 Gb/s of data once packet overhead is counted, so the true figure may be a little higher.
10. Projection: How the Penalty Changes with TP Size
Taking the measured 8K prefill at TP8 and 200 Gb/s as the baseline, and assuming the computation splits evenly across Sparks, the bound of Section 5 projects the following for a real 100 Gb/s link:
| TP size | Projected TTFT increase at 100 Gb/s, 8K prompt |
|---|---|
| TP2 | ≤ 3% |
| TP4 | ≤ 8% |
| TP8 | ≤ 17% (measured on the emulated link: 13.9%; real cable: ≤ 16.9%) |
| TP16 | ≤ 31% |
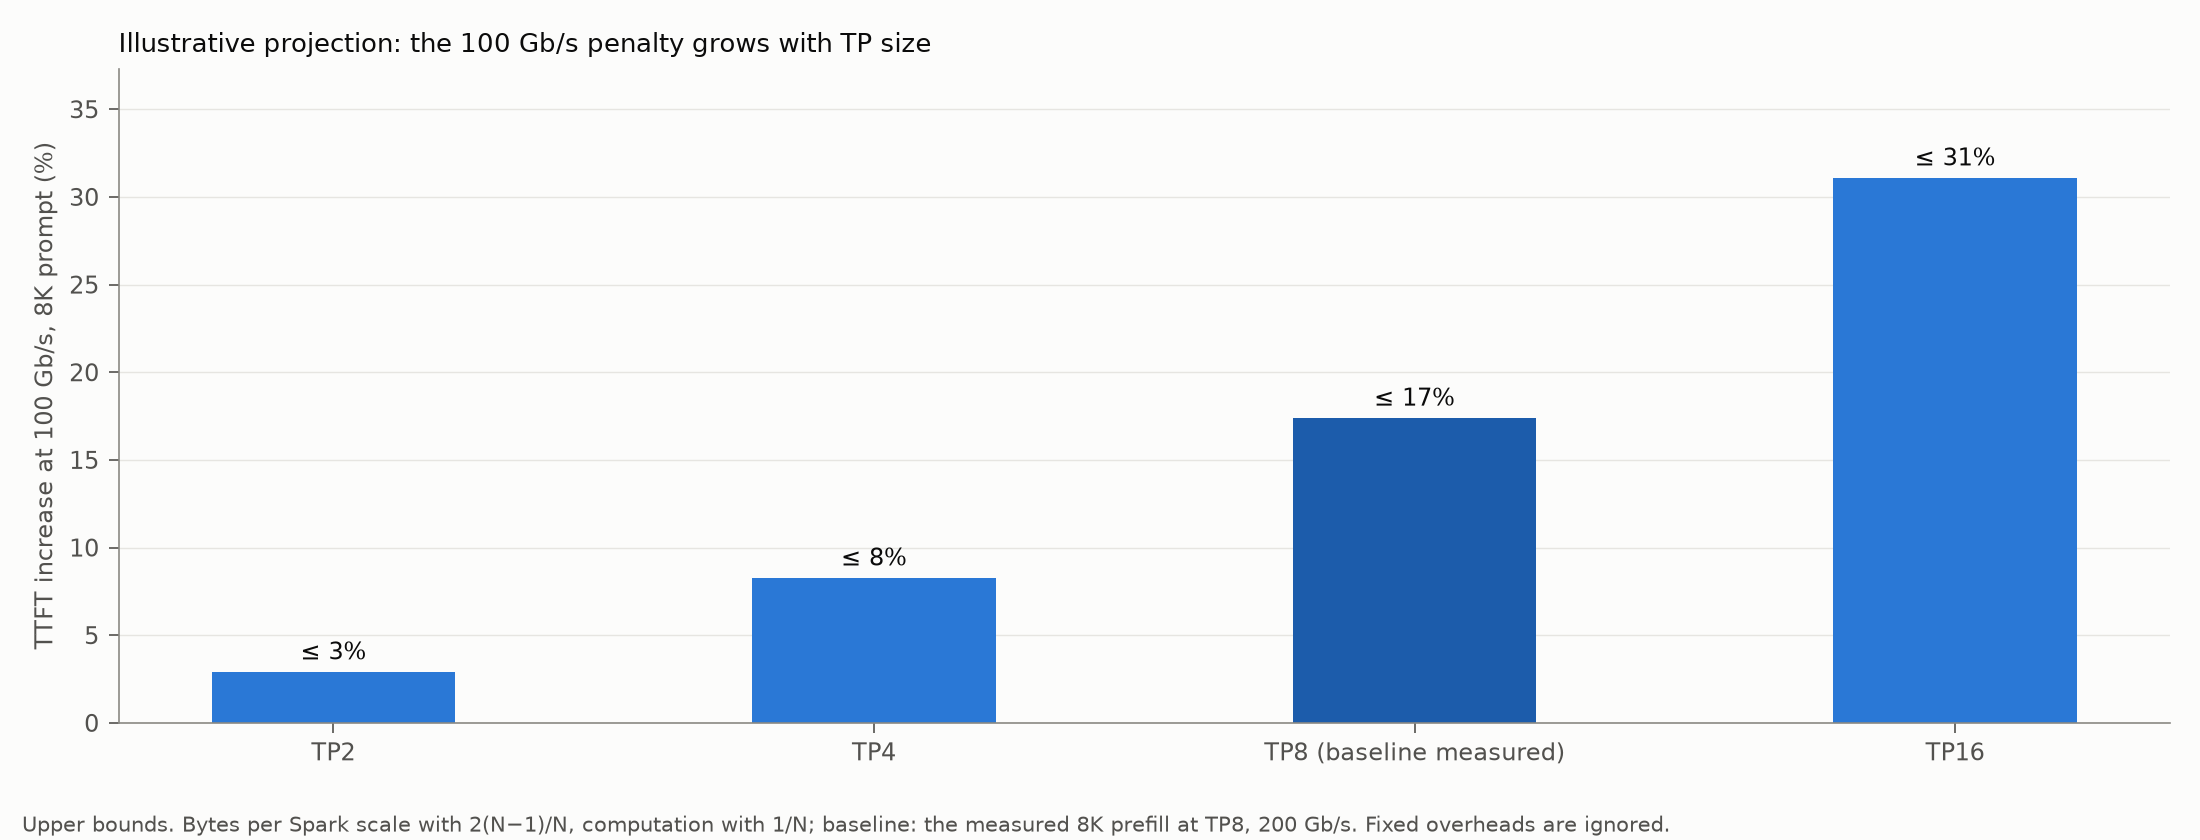
Figure 13: Projected TTFT penalty of 100 Gb/s against TP size (illustrative).
This is a projection, not a measurement: GLM-5.3 does not fit on 2 or 4 Sparks, and fixed overheads are ignored. It shows the direction and the rough size of the effect: at TP16, the penalty would be about twice that at TP8. On 16 Sparks at 100 Gb/s, two TP8 clusters each keep the penalty measured in this paper, while one TP16 cluster would roughly double it.
11. Is 8 Sparks at 100 Gb/s Reasonable?
Yes. Moving an 8-Spark TP8 cluster from 200 Gb/s to 100 Gb/s links:
The first token arrives at most about 20% later for a very long prompt, and at most about 30% later when several very long prompts arrive at the same time. Short to medium prompts see no change. Once the answer starts, it streams at the same pace.
| Workload | Measured (emulated 100 Gb/s) | Real 100 Gb/s cable, at most |
|---|---|---|
| Chat with short to medium prompts (around 1K tokens) | no measurable difference | about +4% |
| A very long prompt: RAG, long documents (8K–64K tokens) | TTFT +12.6–13.9% | TTFT +17% (at most 0.135 s per 1,000 prompt tokens) |
| Several very long prompts arriving together | TTFT per request +17.9–22.5% | TTFT per request +27% |
| Decode speed, in every case | unchanged | unchanged |
These are upper limits for the cases measured; in a mixed workload, most requests are shorter or arrive alone, and see less.
At 100 Gb/s, a CRS812 connects 8 Sparks, enough for one TP8 cluster, at the cost of the longer wait for the first token on long prompts described above; the pace at which the answer streams does not change.
At 100 Gb/s, a CRS804 connects 16 Sparks. Run as two TP8 clusters, each sees the per-Spark link measured in this paper, so the results above apply to each, provided the switch can forward traffic on all ports at full speed at the same time (to be verified). A single TP16 cluster would roughly double the penalty (Section 10) and is not recommended at 100 Gb/s.
200 Gb/s remains the better choice where long prompts with tight TTFT targets dominate the workload, where many users send long prompts at the same time, or where a model has to be spread over more than eight Sparks.
12. Limits and Points to Consider
The measurements cover one model (GLM-5.3), one inference engine and version (vLLM) and one TP size (TP8). Other models, engines and settings send different amounts of data and compute at different speeds; the estimation method carries over, but the numbers have to be recalculated. The 100 Gb/s case was emulated with one network interface rather than built with 100G cables; Section 9 bounds the difference. The TP-size projection in Section 10 is a calculation, not a measurement.
Before choosing 100 Gb/s, check that the switch supports 4 × 100G breakout on its QSFP-DD ports in the planned configuration, that the DGX Spark’s ConnectX-7 links up at 100 Gb/s with the chosen breakout cable, and, for 16 Sparks, that the switch can forward traffic on all ports at full speed at the same time.
Common mistakes when sizing the cluster network
- ✗ Reading the wrong counters: standard Linux tools (
ip -s link,nload,sar) do not see RDMA traffic, so they show an almost idle link during inference. - ✗ Judging link use from averages: one-second or switch-port averages hide the millisecond bursts that decide TTFT.
- ✗ Assuming half the link speed means half the inference speed: only the bursts during prefill slow down; decode does not.
- ✗ Spreading a model over more Sparks than necessary at 100 Gb/s: the penalty grows with TP size.
Checklist for planning an 8- or 16-Spark cluster network
- ☐ Is the TP size per model instance decided (TP8, or two TP8 instances on 16 Sparks)?
- ☐ Is the expected prompt length known (chat, RAG, long documents)?
- ☐ Is there a TTFT target for long prompts?
- ☐ Has the 100 Gb/s penalty been estimated (bytes per prompt token × prompt tokens ÷ 200 Gb/s, Section 5)?
- ☐ Are breakout support and ConnectX-7 link-up at the planned speed verified?
- ☐ Is RDMA traffic monitored with RDMA counters at millisecond resolution?
13. Conclusion
Tensor-parallel inference across DGX Spark systems uses the network in two very different ways. While a prompt is processed, every all-reduce sends tens of megabytes per Spark, in bursts that fill a 200 Gb/s link for a few milliseconds at a time. While the answer is generated, the all-reduces are a few hundred kilobytes or less, and the traffic stays far below 100 Gb/s. Halving the link speed therefore leaves decode speed unchanged and adds a predictable amount to the wait for the first token.
That amount can be estimated from the model’s architecture, the engine’s prefill chunk size and the link speed alone: for GLM-5.3 at TP8, at most 0.135 s per 1,000 prompt tokens at 100 Gb/s. Measured on 8 Sparks with an emulated 100 Gb/s link, single prompts of 8K–64K tokens reached their first token 12.6–13.9% later, close to the estimate; requests arriving together with other long prompts, 17.9–22.5% later; short prompts and decode speed were unaffected. A real 100G cable would add at most another 2.5–3.5 percentage points.
For an 8-Spark TP8 cluster with 100 Gb/s links, expect the first token at most about 20% later for a very long prompt and at most about 30% later when several very long prompts arrive together, no change for short to medium prompts, and no change in how fast the answer streams. Because the penalty grows with TP size, 16 Sparks at 100 Gb/s are best run as two TP8 clusters.
Appendix A: Measuring RDMA Traffic
Because RDMA bypasses the operating system’s network stack, the usual interface statistics do not count it. The traffic in this study was read from the ConnectX-7’s RDMA port counters (port_xmit_data and port_rcv_data under /sys/class/infiniband/, in units of 4 bytes) for each of the two RDMA devices, and summed for the port. A cross-check against the adapter’s own byte counters agreed within 0.2%.
A small sampler read the counters every 1 ms on one Spark and timestamped each read individually, on the same clock the benchmark used for its requests. Rates over 1 ms and longer intervals were computed by spreading the bytes of each sampling interval over the averaging intervals it covers. The byte counts are exact, but the time of each read is known only to about ±0.1–0.2 ms, so a single 1 ms value is uncertain by about ±15–25%; this is why some 1 ms values in the figures appear slightly above the link speed. Averages over 5 ms or longer are accurate to a few percent.
The choice of averaging interval changes the highest value a measurement reports, as Section 8.1 shows: the same traffic peaks at 181 Gb/s in 1 ms intervals, 96 Gb/s in 5 ms intervals and 44 Gb/s in 100 ms intervals, while its average is the same in all of them. A peak value is meaningful only together with its averaging interval.
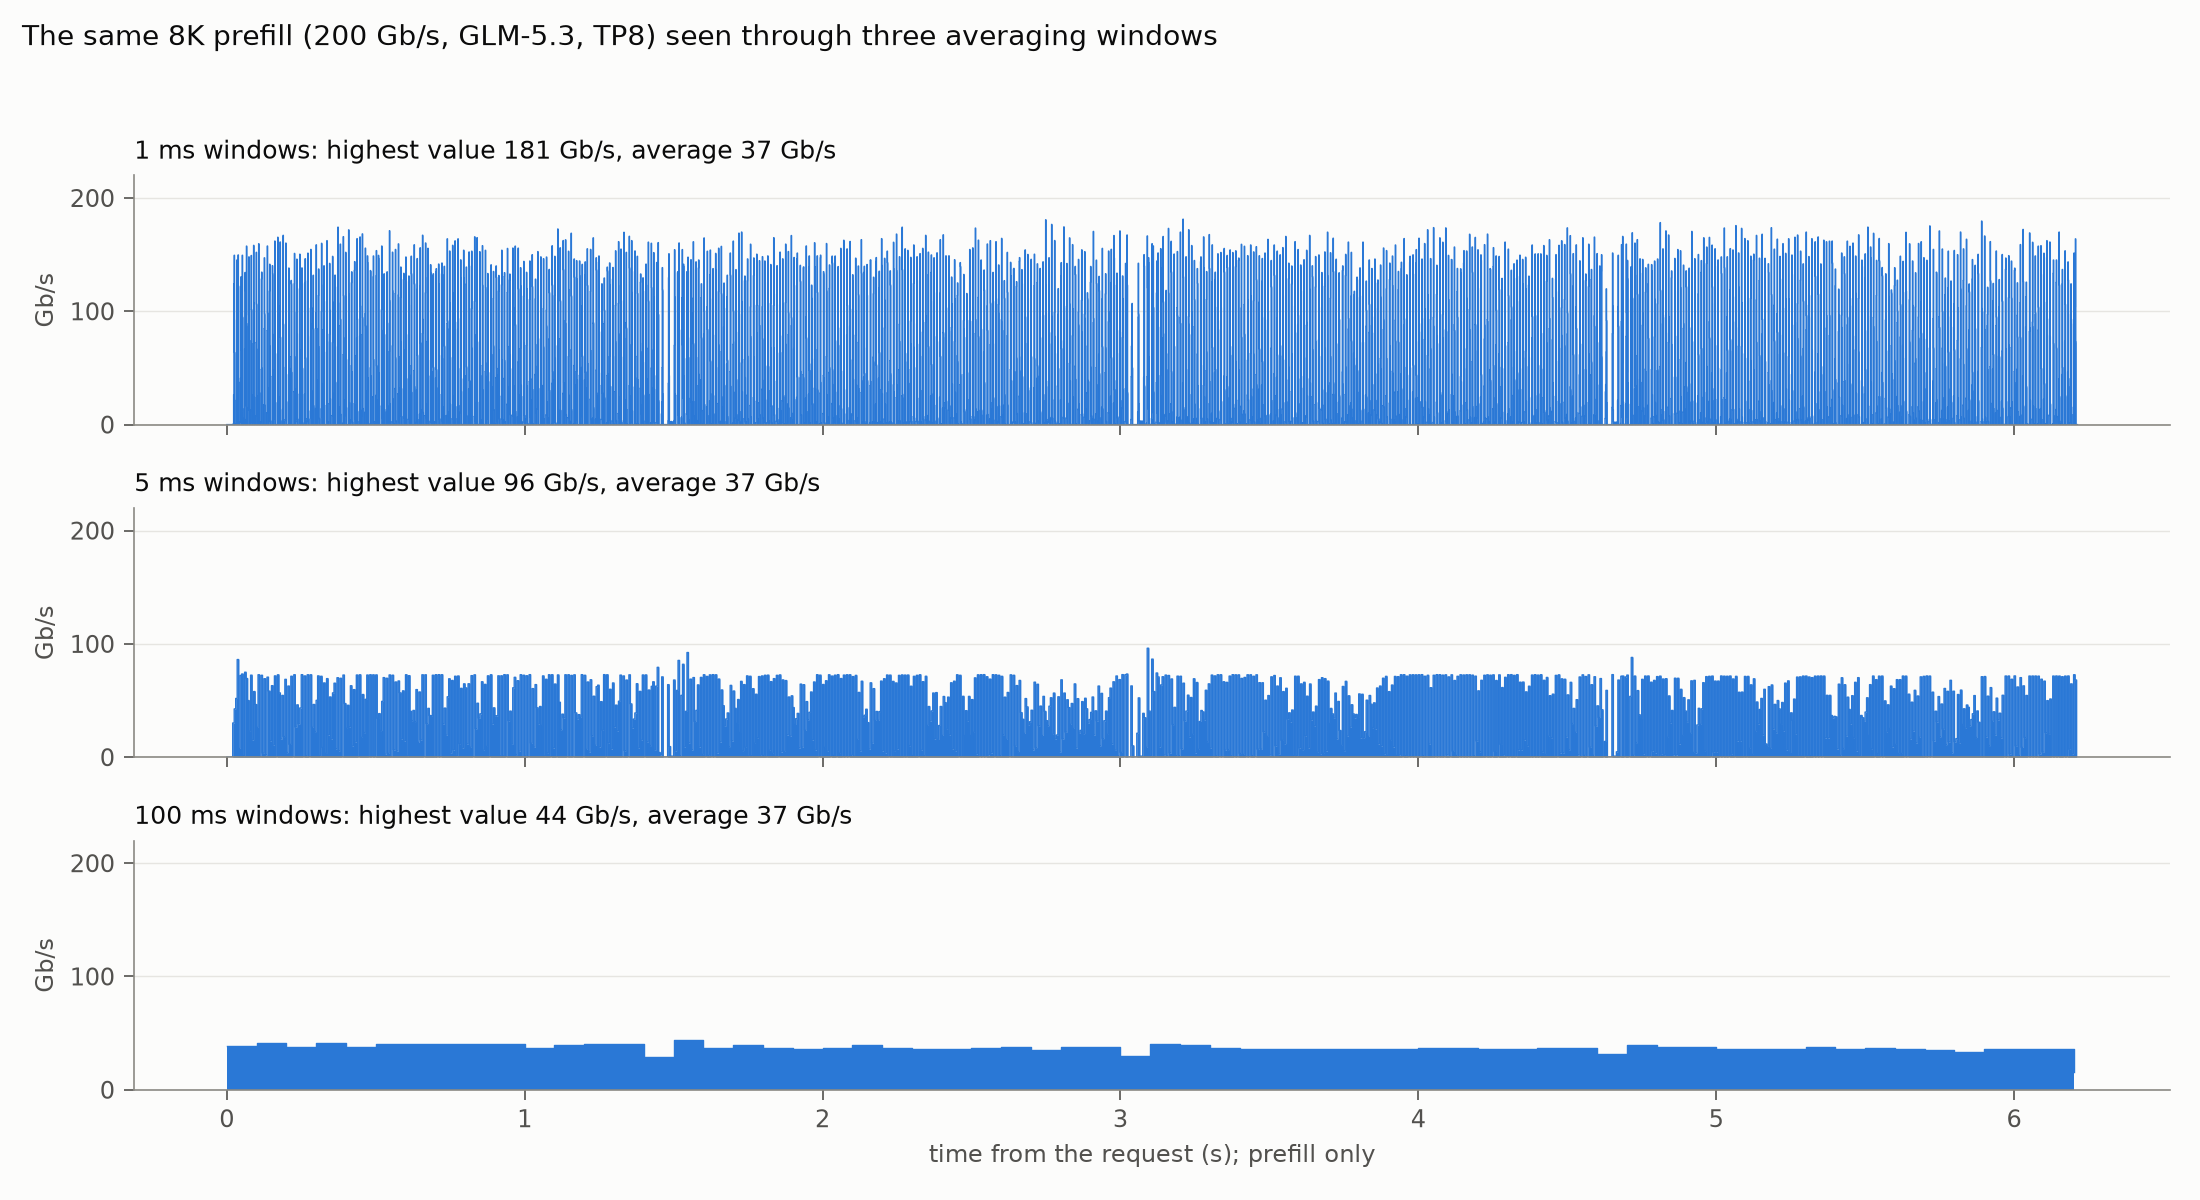
Figure A1: The same prefill traffic averaged over 1 ms, 5 ms and 100 ms intervals.
The measurement itself did not affect the network: bandwidth and latency tests (ib_write_bw, ib_write_lat) with the sampler running and stopped showed the same bandwidth (109.07, 109.08 and 109.15 Gb/s) and at most about 1% difference in latency. The sampler and the benchmark driver together used well under one of the Spark’s 20 CPU cores.
Appendix B: Reproducibility
| Item | Value |
|---|---|
| Test driver | sends the test requests to the engine as streaming requests, timestamps the first and every following token of each answer, and records the RDMA counters alongside on the same clock (Sections 7.4–7.6, Appendix A) |
| Model | Inferact/GLM-5.3-NVFP4 |
| Engine | vLLM 0.1.dev20133+gb5f995e73, container vllm-node-b12x, NCCL 2.28.3 |
| Serve settings | --tensor-parallel-size 8, --max-num-batched-tokens 4096, --long-prefill-token-threshold 2048, --max-num-seqs 8, --max-model-len 262144, --kv-cache-dtype fp8, --gpu-memory-utilization 0.726, --enable-chunked-prefill, --enable-prefix-caching; speculative decoding: MTP, 4 tokens, draft not split |
| NCCL | NCCL_IB_HCA with both RDMA devices (200 Gb/s); second device excluded (100 Gb/s emulation); RoCE v2, GID index 3 |
| Plan | tests P1–P6 (Section 7.4), 1 warm-up and 3 measured rounds, fixed seed, 1,024 output tokens |
Glossary (Terms)
- Activations: The vectors that represent each token as it passes through the model’s layers.
- All-reduce: A collective operation that adds up data held in parts on every device and gives every device the full sum.
- Bandwidth-bound / latency-bound: A transfer is bandwidth-bound when its duration is set by how fast the link moves bytes (large transfers), and latency-bound when it is set by fixed delays (small transfers).
- Breakout cable: A cable that splits one fast switch port (for example 400 Gb/s) into several slower links (for example 4 × 100 Gb/s).
- ConnectX-7: The NVIDIA network adapter built into DGX Spark.
- Decode: The phase that generates the answer, one forward pass at a time.
- Decode speed: How fast the answer streams: output tokens per second after the first token.
- Emulation: Reproducing a condition (here, a 100 Gb/s link) on the real hardware, as opposed to modelling it in software.
- Forward pass: One run of the model’s layers over the tokens currently being processed.
- Hidden dimension: The length of the vector that represents each token inside the model (6,144 for GLM-5.3).
- MTP (multi-token prediction): A form of speculative decoding in which the model drafts several tokens that are then checked in one forward pass.
- NCCL: NVIDIA’s library for communication between GPUs, which the inference engine uses for all-reduce.
- Network interface: What the operating system sees of a network adapter’s connection; here, each ConnectX-7 port appears as two interfaces, one per PCIe link.
- Network share of prefill time: The time needed to send the prefill bytes at 200 Gb/s, divided by the prefill time.
- Nominal link speed: The rated speed of a link (here 200 Gb/s), before protocol overhead.
- NVFP4: NVIDIA’s 4-bit floating-point number format, with a scaling factor shared by each group of 16 values.
- Prefill: The phase that processes the prompt before the first output token.
- Prefill chunk: The part of a prompt processed in one forward pass (up to 4,096 tokens here).
- RDMA: Remote direct memory access: the network adapter reads and writes application memory directly, without the data passing through the operating system’s network stack.
- Ring all-reduce: An all-reduce in which devices pass segments of the data around a ring; each device sends 2 × (N − 1) / N times the data in total.
- RoCE v2: RDMA over Converged Ethernet, version 2: RDMA packets carried inside UDP/IP over standard Ethernet.
- Tensor parallelism (TP): Splitting every weight matrix of a model across several devices, which combine their partial results after each step.
- TTFT (time to first token): The time from sending a request to receiving the first token of the answer.
Resources
Hardware:
- NVIDIA DGX Spark — https://www.nvidia.com/en-us/products/workstations/dgx-spark/
- NVIDIA ConnectX-7 adapter documentation — https://docs.nvidia.com/networking/display/connectx7vpi/introduction
- MikroTik CRS804 DDQ — https://mikrotik.com/product/crs804_ddq
- MikroTik CRS812 DDQ — https://mikrotik.com/product/crs812_ddq
Model and software:
- GLM-5.3 NVFP4 checkpoint — https://huggingface.co/Inferact/GLM-5.3-NVFP4
- vLLM — https://github.com/vllm-project/vllm
- NCCL — https://github.com/NVIDIA/nccl
- perftest (
ib_write_bw,ib_write_lat) — https://github.com/linux-rdma/perftest
Related papers:
Notes
- Estimates: Sections 3–6 use only the model’s configuration, the engine’s settings and the link speed; the bounds are upper limits. The TP-size projection (Section 10) uses the measured TP8 baseline and is illustrative.
- Measurements: All performance figures were measured on 8× DGX Spark with GLM-5.3 at TP8, as described in Section 7; network traffic was read from the ConnectX-7 RDMA counters of one Spark (Appendix A).
- Emulation: 100 Gb/s was emulated by restricting communication to one of the two network interfaces of each ConnectX-7 port, which carries up to 109 Gb/s; Section 9 bounds the difference from a real 100G cable.
- Currency: Engine versions and settings change quickly; the results are valid for the versions listed, as of October 2026.

Let’s plan your DGX Spark cluster network together. For sizing that accounts for model size, tensor parallelism and link speed, contact OpenZeka: support@openzeka.com · openzeka.com