Prepared by: Openzeka Teknoloji A.Ş. — Official Embedded Compute Distributor for NVIDIA Türkiye & MEA, and NVIDIA Elite Partner
Test platform: NVIDIA DGX-B300 (8× Blackwell Ultra, TP=8) · Model: Moonshot AI Kimi K3 · Report date: July 2026
Contents
- 1. Executive Summary
- 2. Test Setup & Methodology
- 3. Deployment Configurations
- 4. Results
- 5. SLO & Relative Capacity Analysis
- 6. Comparison Framework & Interpretation Guide
- 7. Conclusion
- Appendix A: All CSV Data
- Appendix B: Comparison Charts
1. Executive Summary
This report compares four different deployment configurations of the Kimi K3 model on the same hardware (DGX-B300, TP8): vLLM (direct), vLLM + DSpark speculative, SGLang (direct), and SGLang + DSpark speculative.
Key Findings
-
At low load (c=1) speculative decoding yields a clear gain: vLLM + Spec is 1.86x faster than vLLM direct (188 vs 101 tok/s). SGLang + Spec is 1.56x faster (130 vs 83 tok/s).
-
At high load speculative decoding becomes a bottleneck: vLLM + Spec @c=64: per-user TPS drops to 11 tok/s (vLLM direct 27 tok/s). Break-even point: ~c16 for vLLM, ~c4 for SGLang.
-
Despite SGLang direct’s lower TTFT issue, at high load (c=64) it produces similar aggregate output (1863 vs 1759 tok/s).
-
vLLM direct is the most reliable general-purpose choice: Fast at low load (66ms TTFT), scales linearly at high load, and fully meets the P90 SLO up to c=32 (at c=64 it only slightly exceeds TTFT: 1107ms).
-
SGLang + Spec shows a severe anomaly: at c=64, TTFT spikes to 4752ms (was 777ms at c=32) — the scheduler collapses under extreme load.
Scenario-Based Recommendation
| Scenario | Recommended Config | Rationale |
|---|---|---|
| Low-load interactive chat (c<=8) | vLLM + Spec | 1.4-1.9x faster per-user TPS |
| Production / high-load serving (c>16) | vLLM (direct) | Scalable, meets SLO, stable |
| Maximum aggregate throughput | vLLM (direct) or SGLang (direct) | c=64: ~1759 / 1863 tok/s aggregate |
| Minimum ITL (real-time) | vLLM + Spec (only c<=4) | ITL 4.8ms (direct 9.5ms) |
| Long-context-heavy workloads | (out of scope for this report) | 128/128 token test is limited |
2. Test Setup & Methodology
2.1 About the Model
Kimi K3 is an open-weight, native multimodal and agentic model developed by Moonshot AI. This 2.8T-parameter model is built on the Kimi Delta Attention (KDA) and Attention Residuals (AttnRes) architectures and has a 1M-token context window. As the world’s first open 3T-class model, it is designed for long-horizon coding, knowledge work, and reasoning.
- Model page: huggingface.co/moonshotai/Kimi-K3
Key Features
- New Architecture: Built on KDA + AttnRes, with the Stable LatentMoE framework activating 16 of 896 experts — ~2.5x scaling efficiency over Kimi K2.
- Long-Horizon Coding: Sustains long engineering sessions with minimal human supervision; GPU kernel optimization, compiler development, CAD, and chip design.
- Agentic Knowledge Work: Produces deep research, interactive visualizations, widgets, dashboards, and motion design.
- Native Multimodality & Long Context: Understands text, image, and video within the same model; supports a 1M-token context window.
- Open Frontier Weights: Full model weights released under the Kimi K3 License.
Model Summary
| Property | Value |
|---|---|
| Architecture | Mixture-of-Experts (MoE) |
| Total Parameters | 2.8T |
| Active Parameters | 104B |
| Layer Count | 93 |
| Dense Layer Count | 1 |
| Attention Layer Composition | 69 KDA + 24 Gated MLA |
| Attention Hidden Dimension | 7168 |
| Attention Head Count | 96 |
| Latent MoE Dimension | 3584 |
| MoE Hidden Dimension (per expert) | 3072 |
| Expert Count | 896 |
| Experts Selected per Token | 16 |
| Shared Expert Count | 2 |
| Vocabulary Size | 160K |
| Context Length | 1,048,576 (1M tokens) |
| Attention Mechanism | KDA & Gated MLA |
| Activation Function | SiTU-GLU |
| Vision Encoder | MoonViT-V2 |
| Vision Encoder Parameters | 401M |
| Quantization | MXFP4 weights / MXFP8 activations (quantization-aware training) |
| Modality | Text, Image |
The model was deployed with --max-model-len 1048576, i.e. the full 1M context capacity active.
2.2 Quantization & License
Native MXFP4 Quantization: Kimi K3 applies quantization-aware training from the SFT stage onward. It uses MXFP4 weights with MXFP8 activations — this provides broad hardware compatibility and minimizes accuracy loss while reducing weight size.
License: The code repository and model weights are released under the Kimi K3 License.
2.3 Hardware & Deployment
- GPU: NVIDIA DGX-B300 (Blackwell Ultra, 8x GPU)
- Parallelism: Tensor Parallel = 8 (TP8)
- KV Cache: FP8 (
--kv-cache-dtype fp8) - Memory Utilization: 0.95
- Prefix Caching: Enabled (
--enable-prefix-caching)
2.4 Benchmark Tool
CordatusAI/llm-benchmark — a Streamlit-based, interactive tool that tests OpenAI-compatible APIs.
2.5 Test Parameters
| Parameter | Value | Description |
|---|---|---|
| Input token | ~128 | per prompt |
| Output token | 128 | max_tokens=128 |
| Concurrency | 1, 2, 4, 8, 16, 32, 64 | concurrent requests |
| Min round / concurrency | 10 | min repetitions per level |
| Total requests / level | 10 x c | c=64 -> 640 requests |
| Warm-up | 1 request | stabilization before measurement |
Important: Input and output are fixed at 128 tokens. This is designed for relative comparison; it does not represent real production workloads (variable length, multi-turn, long context). See Section 6 for details.
2.6 Metrics
| Metric | Unit | Definition |
|---|---|---|
| TTFT | ms | Time To First Token — time elapsed until the first token is produced |
| ITL | ms | Inter-Token Latency — average time between consecutive tokens |
| TPS | tok/s | Per-user Tokens Per Second — single-request output rate |
| Latency | s | Total request duration (end to end) |
| Throughput | RPS | Completed requests per second per system |
Each metric is reported as Mean, P50 (median), P90.
2.7 SLO Thresholds (defaults)
| SLO | Threshold | Basis |
|---|---|---|
| TTFT | <= 1000 ms | Nielsen “flow of thought” limit (1s) |
| TPS | >= 15 tok/s | Human visual reading speed limit (~700 wpm) |
2.8 Capacity Planning (Little’s Law)
Find the maximum concurrency that meets the SLO (C_max), then the total user count:
N = C_max x (1 + T_think / L_mean)
T_think = 45s(default: reading + prompt writing)L_mean= mean latency at the C_max level
Important: These numbers are for relative comparison, not absolute production estimates. They are based on the 128/128 token workload and a 45s think-time assumption.
3. Deployment Configurations
3.1 Summary
Four deployment configurations are compared in this report:
| Config | Engine | Speculative | Draft Model | Draft Model Source |
|---|---|---|---|---|
| vLLM (direct) | vLLM (kimi-k3 docker) | No | - | - |
| vLLM + Spec | vLLM (kimi-k3 docker) | DSpark | Inferact/Kimi-K3-DSpark |
vLLM recipes |
| SGLang (direct) | SGLang (kimi-k3 docker) | No | - | - |
| SGLang + Spec | SGLang (kimi-k3 docker) | DSpark | RadixArk/Kimi-K3-DSpark |
SGLang cookbook |
Important note: vLLM and SGLang recommend two different draft models in their official recipes/cookbooks. In this benchmark, each engine used its own recommended draft model — i.e. vLLM+Spec ran with
Inferact/Kimi-K3-DSpark, and SGLang+Spec ran withRadixArk/Kimi-K3-DSpark. This reflects each engine’s manufacturer-recommended optimal configuration.
3.2 About Speculative Decoding (DSpark)
DSpark is a draft-model-based speculative decoding method specialized for Kimi K3:
- ~7 token proposals are generated per step (
num_speculative_tokens=7) - Verified via rejection sampling (block method)
- At low load: decode speed up to 2x (benefits from KV cache transfer)
- At high load: draft model + verification overhead creates scheduler pressure
Both engines use the DSpark method, but with different draft-model weights. These draft models are small models trained specifically for Kimi K3 and adapted to each engine’s own optimization pipeline.
3.3 Docker Commands (Full)
The following commands are taken from vLLM’s and SGLang’s official Kimi K3 recipes:
- vLLM: recipes.vllm.ai/moonshotai/Kimi-K3
- SGLang: docs.sglang.io/cookbook/autoregressive/Moonshotai/Kimi-K3
3.3.1 vLLM (Direct — No Speculation)
docker run --gpus all \
  --privileged --ipc=host -p 8000:8000 \
  -v ~/.cache/huggingface:/root/.cache/huggingface \
  -e VLLM_ENABLE_K3_LATENT_MOE_TAIL_FUSION=1 \
  -e VLLM_ALLREDUCE_USE_FLASHINFER=1 \
  -e VLLM_ENGINE_READY_TIMEOUT_S=3600 \
  -e VLLM_USE_V2_MODEL_RUNNER=1 \
  -e VLLM_USE_RUST_FRONTEND=1 \
  vllm/vllm-openai:kimi-k3 moonshotai/Kimi-K3 \
  --trust-remote-code \
  --load-format fastsafetensors \
  --moe-backend auto \
  --gpu-memory-utilization 0.95 \
  --tensor-parallel-size 8 \
  --max-model-len 1048576 \
  --kv-cache-dtype fp8 \
  --attention-config '{"mla_prefill_backend":"TRTLLM_RAGGED","use_prefill_query_quantization":true}' \
  --enable-prefix-caching \
  --enable-auto-tool-choice \
  --tool-call-parser kimi_k3 \
  --reasoning-parser kimi_k3
3.3.2 vLLM + Speculative (DSpark)
docker run --gpus all \
  --privileged --ipc=host -p 8000:8000 \
  -v ~/.cache/huggingface:/root/.cache/huggingface \
  -e VLLM_ENABLE_K3_LATENT_MOE_TAIL_FUSION=1 \
  -e VLLM_ALLREDUCE_USE_FLASHINFER=1 \
  -e VLLM_ENGINE_READY_TIMEOUT_S=3600 \
  -e VLLM_USE_V2_MODEL_RUNNER=1 \
  -e VLLM_USE_RUST_FRONTEND=1 \
  vllm/vllm-openai:kimi-k3 moonshotai/Kimi-K3 \
  --trust-remote-code \
  --load-format fastsafetensors \
  --moe-backend auto \
  --gpu-memory-utilization 0.95 \
  --tensor-parallel-size 8 \
  --max-model-len 1048576 \
  --kv-cache-dtype fp8 \
  --attention-config '{"mla_prefill_backend":"TRTLLM_RAGGED","use_prefill_query_quantization":true}' \
  --enable-prefix-caching \
  --enable-auto-tool-choice \
  --tool-call-parser kimi_k3 \
  --reasoning-parser kimi_k3 \
  --max-num-seqs 32 \
  --speculative-config '{"model":"Inferact/Kimi-K3-DSpark", "num_speculative_tokens":7, "method": "dspark", "attention_backend": "FLASHINFER_MLA", "draft_sample_method": "probabilistic", "rejection_sample_method": "block"}'
3.3.3 SGLang (Direct — No Speculation)
docker run --gpus all \
  --shm-size 32g \
  -p 30000:30000 \
  -v ~/.cache/huggingface:/root/.cache/huggingface \
  --env "HF_TOKEN=<your-hf-token>" \
  --ipc=host \
  lmsysorg/sglang:kimi-k3 \
  sglang serve \
    --trust-remote-code \
    --model-path moonshotai/Kimi-K3 \
    --tp-size 8 \
    --mem-fraction-static 0.85 \
    --reasoning-parser kimi_k3 \
    --tool-call-parser kimi_k3 \
    --mamba-full-memory-ratio 0.9 \
    --host 0.0.0.0 \
    --port 30000
3.3.4 SGLang + Speculative (DSpark)
docker run --gpus all \
  --shm-size 32g \
  -p 30000:30000 \
  -v ~/.cache/huggingface:/root/.cache/huggingface \
  --env "HF_TOKEN=<your-hf-token>" \
  --ipc=host \
  lmsysorg/sglang:kimi-k3 \
  sglang serve \
    --trust-remote-code \
    --model-path moonshotai/Kimi-K3 \
    --tp-size 8 \
    --mem-fraction-static 0.85 \
    --reasoning-parser kimi_k3 \
    --tool-call-parser kimi_k3 \
    --mamba-full-memory-ratio 0.86 \
    --host 0.0.0.0 \
    --port 30000 \
    --speculative-algorithm DSPARK \
    --speculative-draft-model-path RadixArk/Kimi-K3-DSpark \
    --speculative-dspark-block-size 7 \
    --enable-linear-replayssm-spec
3.4 Configuration Differences
Key configuration differences between the two engines:
| Feature | vLLM | SGLang |
|---|---|---|
| Port | 8000 | 30000 |
| Memory utilization | 0.95 (--gpu-memory-utilization) |
0.85 (--mem-fraction-static) |
| KV cache | FP8 (--kv-cache-dtype fp8) |
(default) |
| Prefill backend | TRTLLM_RAGGED + query quantization |
FlashInfer MLA (default) |
| Rust frontend | Enabled (VLLM_USE_RUST_FRONTEND=1) |
- |
| Spec block size | (inside config) | --speculative-dspark-block-size 7 |
| Mamba full memory ratio | - | 0.9 (direct), 0.86 (spec) |
Important: vLLM’s
TRTLLM_RAGGED+use_prefill_query_quantizationoptimization plays a significant role in vLLM’s low TTFT in this benchmark (see Section 3.4).
4. Results
4.1 General Comparison (c=1 and c=64)
Low Load (c=1) — single user
| Metric | vLLM dir | vLLM spec | sglang dir | sglang spec |
|---|---|---|---|---|
| TTFT Mean (ms) | 66.5 | 71.0 | 399.5 | 450.6 |
| ITL Mean (ms) | 9.46 | 4.84 | 8.94 | 4.26 |
| TPS Mean (tok/s) | 100.8 | 187.7 | 83.4 | 129.9 |
| Latency Mean (s) | 1.27 | 0.69 | 1.54 | 0.99 |
| Spec/Direct | 1.0x | 1.86x | 1.0x | 1.56x |
High Load (c=64) — 64 concurrent users
| Metric | vLLM dir | vLLM spec | sglang dir | sglang spec |
|---|---|---|---|---|
| TTFT Mean (ms) | 731.7 | 1030.9 | 948.4 | 4752.6 |
| ITL Mean (ms) | 30.8 | 95.4 | 27.1 | 34.4 |
| TPS Mean (tok/s) | 27.5 | 11.2 | 29.1 | 14.5 |
| Latency Mean (s) | 4.66 | 13.15 | 4.41 | 9.13 |
| Aggregate (tok/s) | 1759 | 717 | 1863 | 931 |
Note: in the sglang-spec @c=64 data there is an inconsistency between TTFT (4752ms) and Latency (9.13s) (TTFT should be > Latency/2); this is a measurement anomaly in the raw data.
4.2 TTFT (Time To First Token)
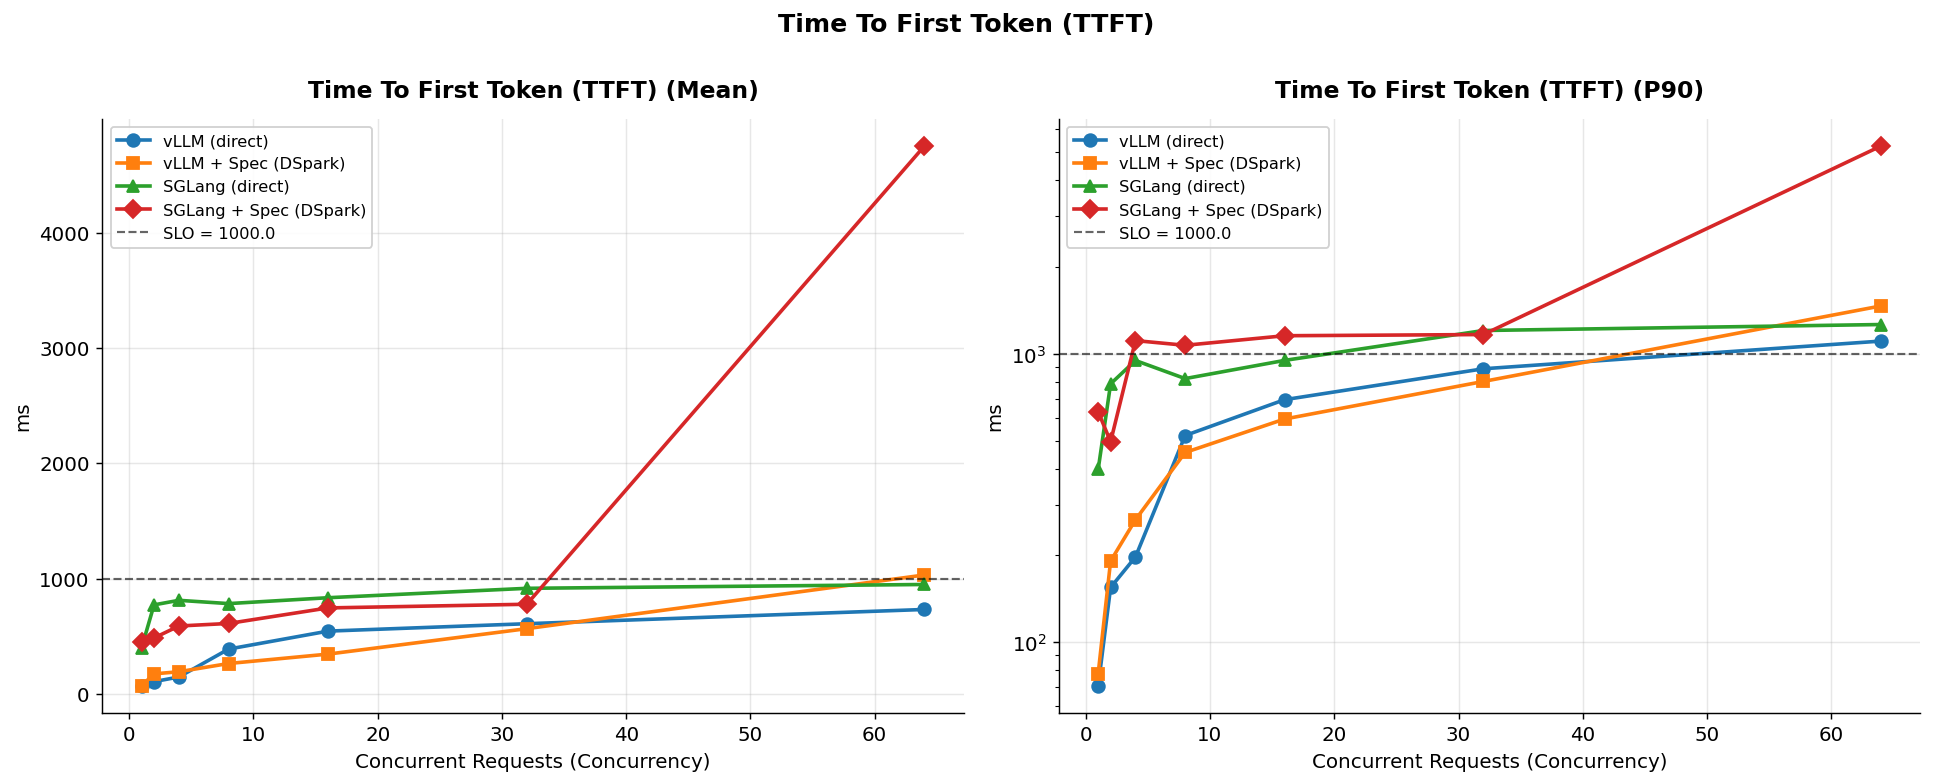
Findings:
- vLLM direct has the fastest TTFT across all load levels (c=1: 66ms, c=64: 732ms).
- SGLang direct has high TTFT (~400ms at c=1) — 6x vLLM’s. The reason is SGLang’s prefill
kernel configuration; vLLM uses
TRTLLM_RAGGED+ query quantization while SGLang uses the default FlashInfer MLA. - Speculative decoding worsens TTFT (draft-model init cost):
- vLLM: 66 -> 71ms at c=1 (+8%)
- SGLang: 400 -> 451ms at c=1 (+13%)
- SGLang + Spec anomaly @c=64: 4752ms — 6.1x worse than at c=32. The scheduler bottlenecks under extreme load.
- The SLO threshold (1000ms) for P90: vLLM direct at c=64 slightly exceeds the SLO at 1107ms; other configs cannot exceed c=32.
4.3 ITL (Inter-Token Latency)
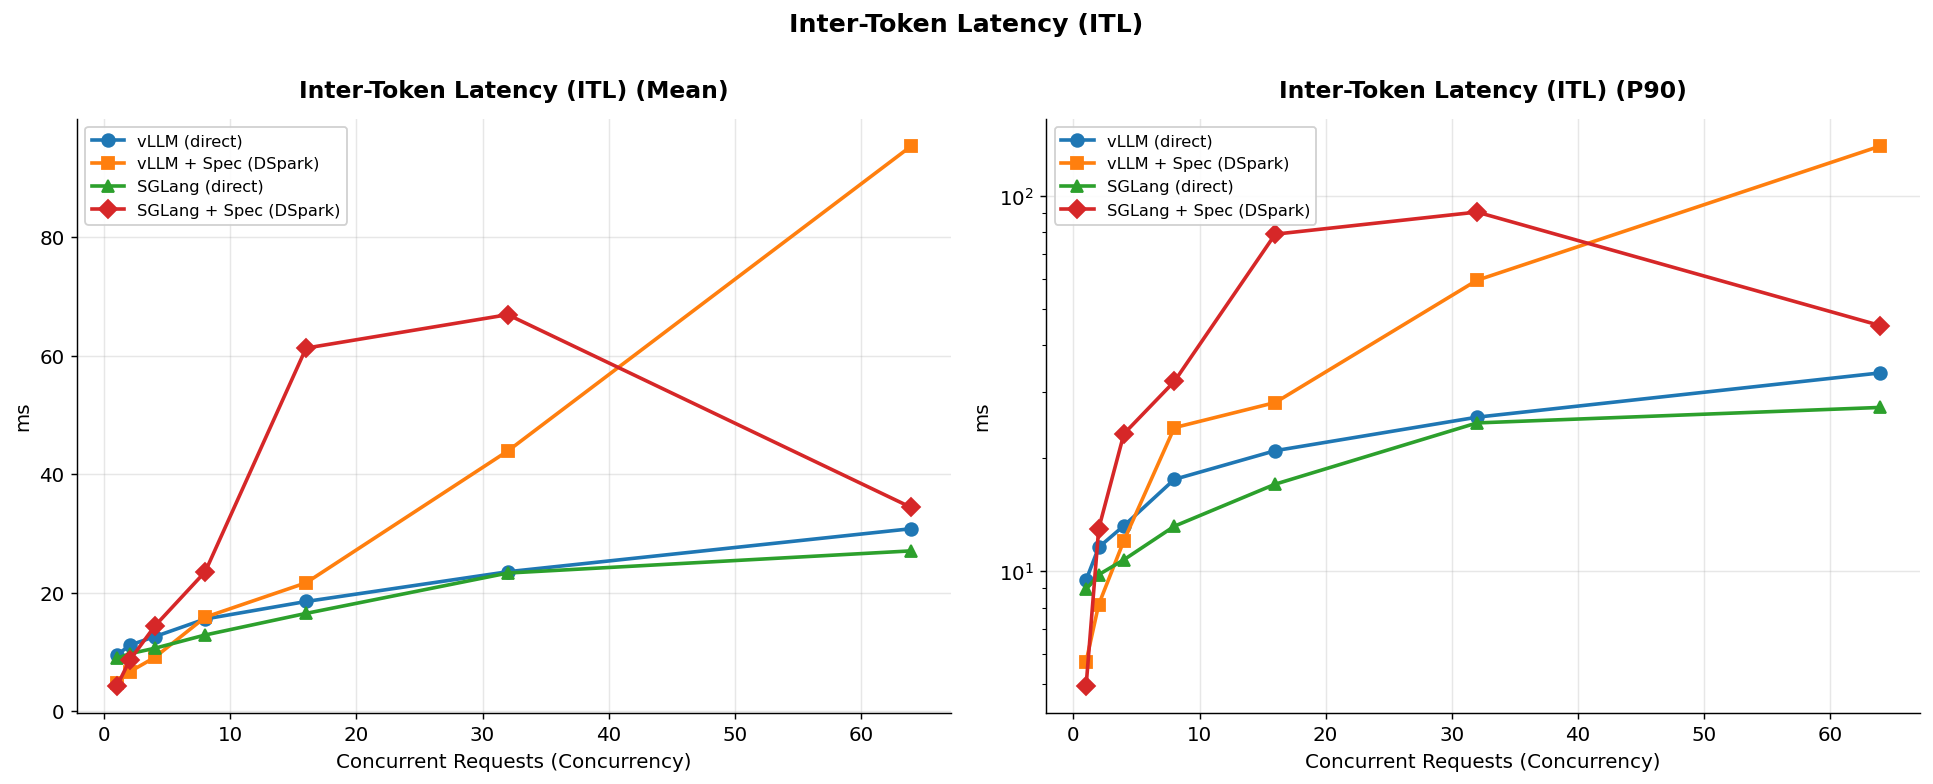
Findings:
- Speculative decoding halves ITL at low load:
- vLLM: 9.46ms -> 4.84ms (49% reduction)
- SGLang: 8.94ms -> 4.26ms (52% reduction)
- At high load, speculative ITL explodes:
- vLLM + Spec @c=64: 95.4ms (direct 30.8ms — 3.1x worse)
- vLLM + Spec @c=32: 43.9ms (direct 23.6ms — 1.9x worse)
- vLLM direct and SGLang direct ITL increases are linear-and-close: ~27-31ms at c=64.
- Lowest ITL (for real-time applications): vLLM + Spec @c=1: 4.84ms — but unusable at high load.
4.4 TPS (Per-User Tokens Per Second)
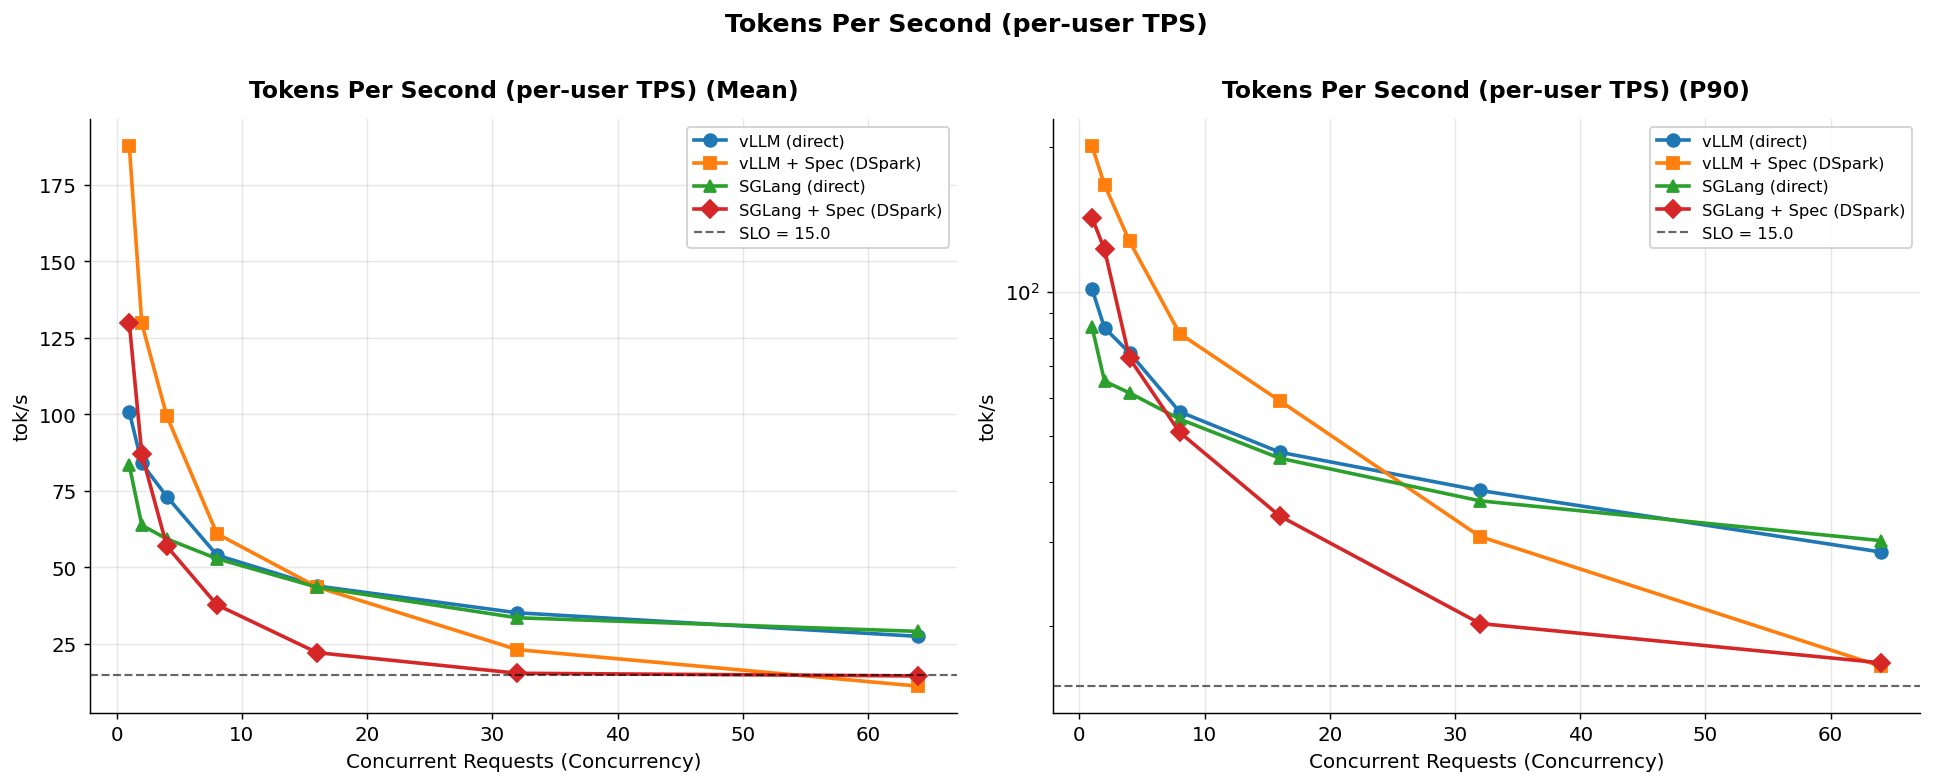
Findings:
- Low load (c<=4): Spec is clearly faster than direct
- vLLM c=1: 101 -> 188 tok/s (1.86x)
- vLLM c=4: 73 -> 99 tok/s (1.36x)
- SGLang c=1: 83 -> 130 tok/s (1.56x)
- Break-even points:
- vLLM: c~16 (43.95 vs 43.60 tok/s) — equal
- SGLang: c~4 (59.3 vs 56.9 tok/s) — spec slightly worse
- High load (c=64): Spec hurts
- vLLM: 27.5 -> 11.2 tok/s (0.41x — 2.4x slower)
- SGLang: 29.1 -> 14.5 tok/s (0.50x)
- SLO (15 tok/s) P90 (TPS threshold):
- vLLM direct: passes all levels (P90 TPS 28.6 at c=64)
- vLLM spec: passes all levels (P90 TPS 16.5 at c=64 — but very low)
- SGLang direct: passes all levels (P90 TPS 30.2 at c=64)
- SGLang spec: passes up to c=32 (P90 TPS 20.3), at c=64 16.8 (barely passes)
- SLO (1000ms) P90 (TTFT threshold):
- vLLM direct: passes up to c=32 (P90 887ms), at c=64 1107ms slightly exceeds
- vLLM spec: passes up to c=32 (P90 802ms), at c=64 1466ms exceeds
- SGLang direct: passes up to c=16 (P90 949ms), at c=32 1205ms exceeds
- SGLang spec: passes up to c=2 (P90 496ms), at c=4 1111ms exceeds
4.5 Latency (Total Request Duration)
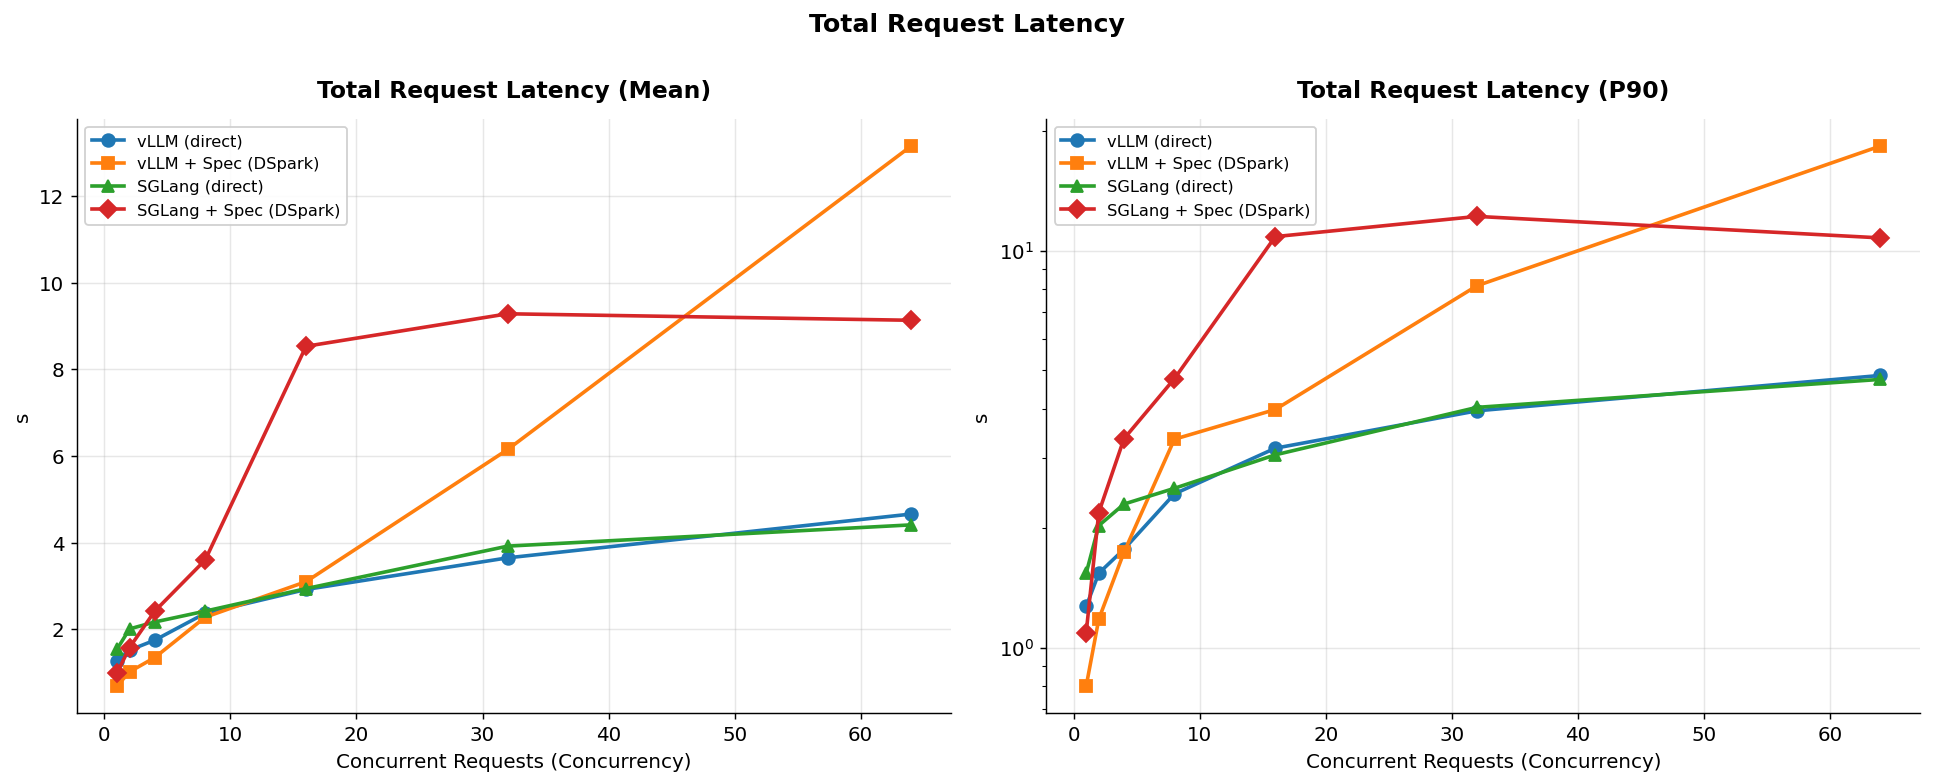
Findings:
- At low load Spec dramatically reduces latency:
- vLLM c=1: 1.27s -> 0.69s (46% reduction)
- SGLang c=1: 1.54s -> 0.99s (36% reduction)
- At high load Spec blows up latency:
- vLLM + Spec @c=64: 13.15s (direct 4.66s — 2.8x worse)
- SGLang + Spec @c=32: 9.28s (direct 3.92s — 2.4x worse)
- vLLM direct vs SGLang direct are similar at high load (c=64: 4.66 vs 4.41s).
- vLLM direct shows linear scaling (c=1: 1.27s, c=64: 4.66s — 3.7x increase for 64x load).
4.6 Throughput (RPS)
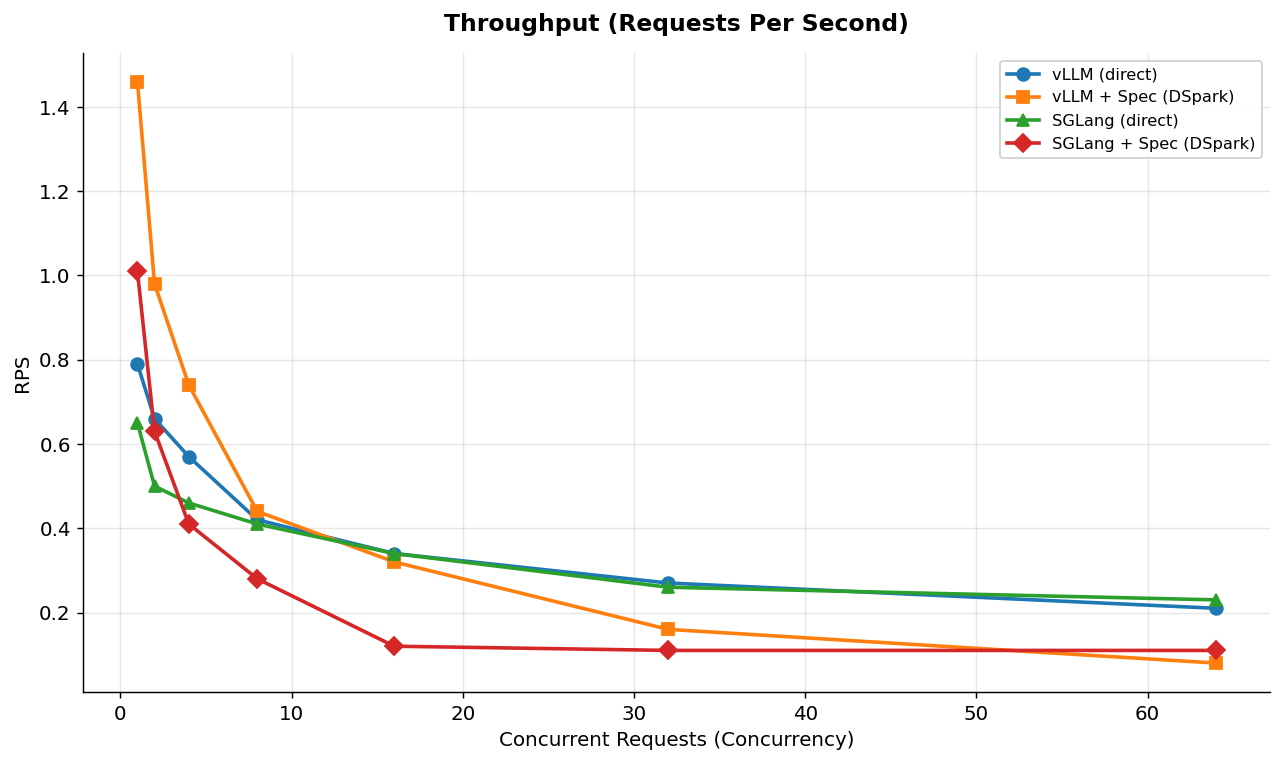
Findings:
- At low load Spec yields higher RPS (because it completes faster):
- c=1: vLLM spec 1.46 RPS vs vLLM direct 0.79 RPS (1.85x)
- At high load direct yields better RPS (less overhead):
- c=64: vLLM direct 0.21 RPS vs vLLM spec 0.08 RPS (0.38x)
- RPS drops for all configs as concurrency rises — this is expected; each request takes longer but there are more concurrent requests.
- SGLang + Spec @c=64 RPS is the same as c=32 (0.11) — a sign of bottleneck.
4.7 Total Tokens Produced / Second (Aggregate Output)
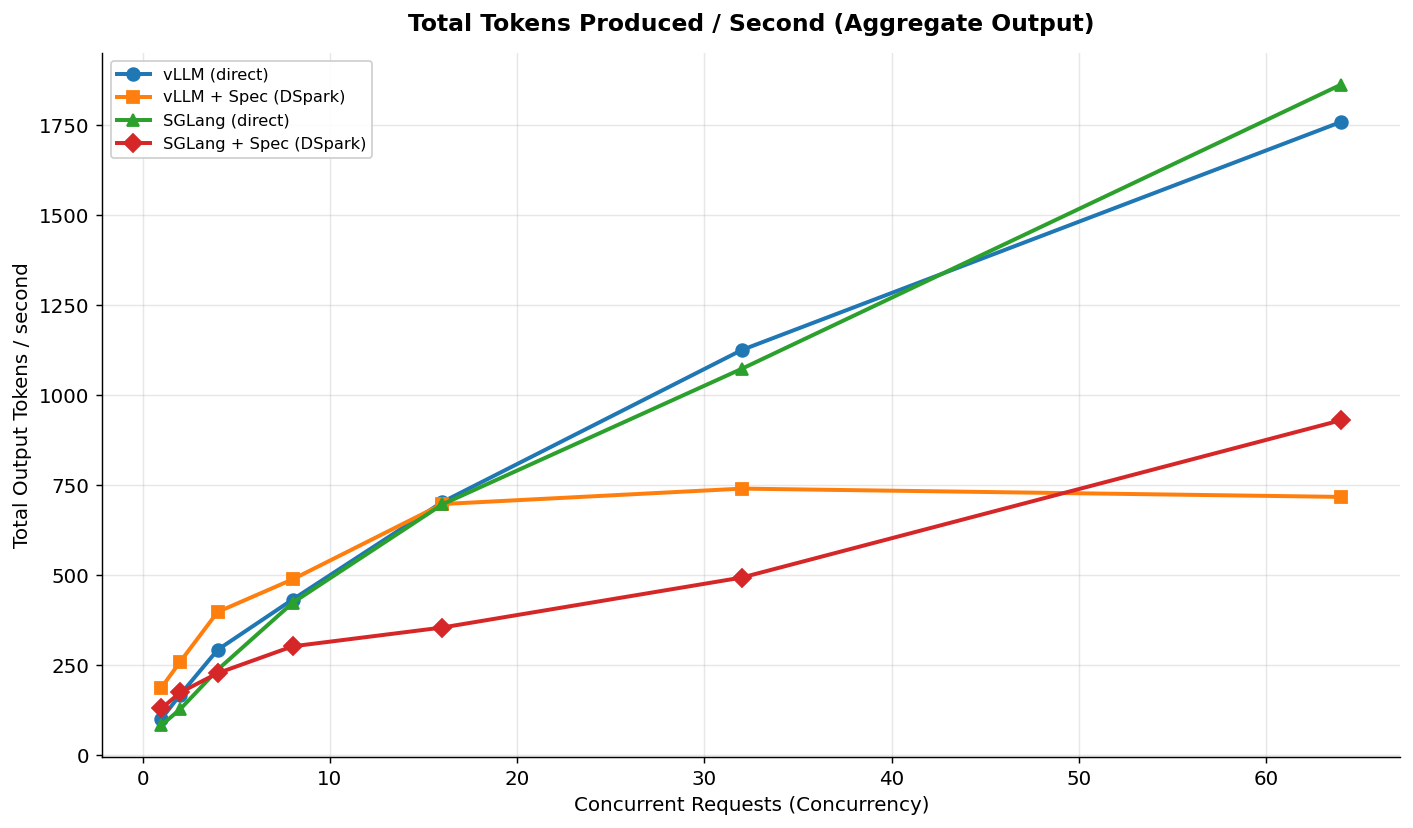
This metric shows the total production capacity of the system: TPS x Concurrency.
| c | vLLM dir | vLLM spec | sglang dir | sglang spec |
|---|---|---|---|---|
| 1 | 101 | 188 | 83 | 130 |
| 4 | 293 | 398 | 237 | 228 |
| 16 | 703 | 698 | 697 | 355 |
| 32 | 1126 | 740 | 1074 | 493 |
| 64 | 1759 | 717 | 1863 | 931 |
Findings:
- vLLM direct linear scaling: c=1 (101) -> c=64 (1759) — 17.4x increase for 64x load (sub-linear but strong).
- SGLang direct highest at c=64: 1863 tok/s — 6% better than vLLM.
- vLLM + Spec bottleneck: c=32 to 740 -> c=64 717 — drops! i.e. doubling the load reduces total output — a classic bottleneck.
- SGLang + Spec bad from c=16 onward: c=16 355 (direct 697) — half of direct.
- Most efficient point (peak aggregate):
- vLLM direct: c=64 (1759)
- vLLM spec: c=16 (698) — drops afterward
- SGLang direct: c=64 (1863)
- SGLang spec: c=32 (493)
4.8 Speculative Speedup Analysis
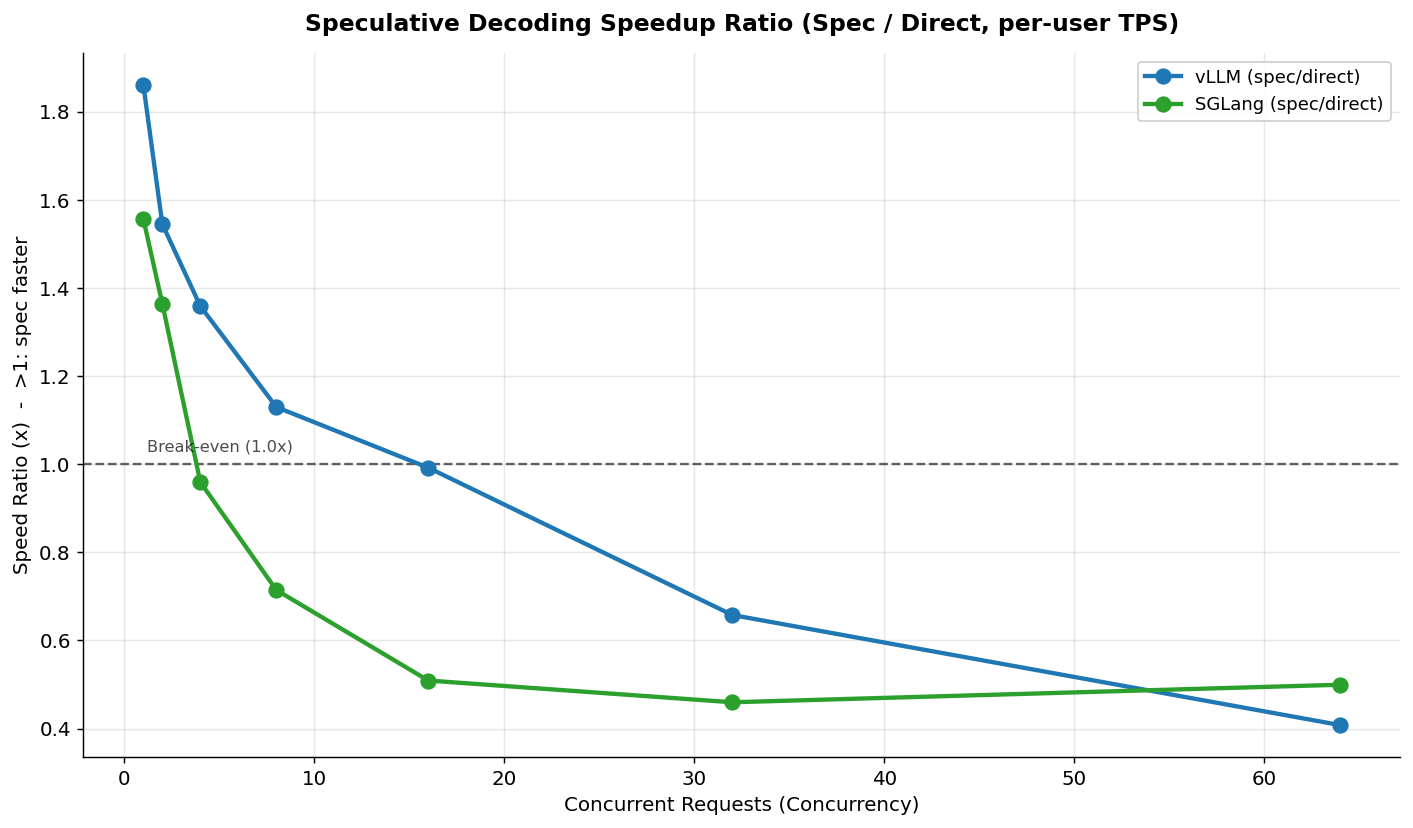
Spec/Direct TPS ratio vs concurrency:
| c | vLLM (spec/dir) | SGLang (spec/dir) |
|---|---|---|
| 1 | 1.86x | 1.56x |
| 2 | 1.55x | 1.36x |
| 4 | 1.36x | 0.96x |
| 8 | 1.13x | 0.71x |
| 16 | 0.99x (break-even) | 0.51x |
| 32 | 0.66x | 0.46x |
| 64 | 0.41x | 0.50x |
Findings:
- vLLM Spec break-even: c~16. Beyond that, a net loss.
- SGLang Spec break-even: c~4. Breaks very early.
- The reason Spec breaks earlier on SGLang: SGLang’s already-high TTFT
- draft-model overhead pushes it over the edge sooner.
- Rule of thumb: Speculative decoding should only be used in low-load interactive scenarios (c<16 vLLM, c<4 SGLang). For high-load production it hurts.
5. SLO & Relative Capacity Analysis
5.1 SLO Compliance Matrix (P90)
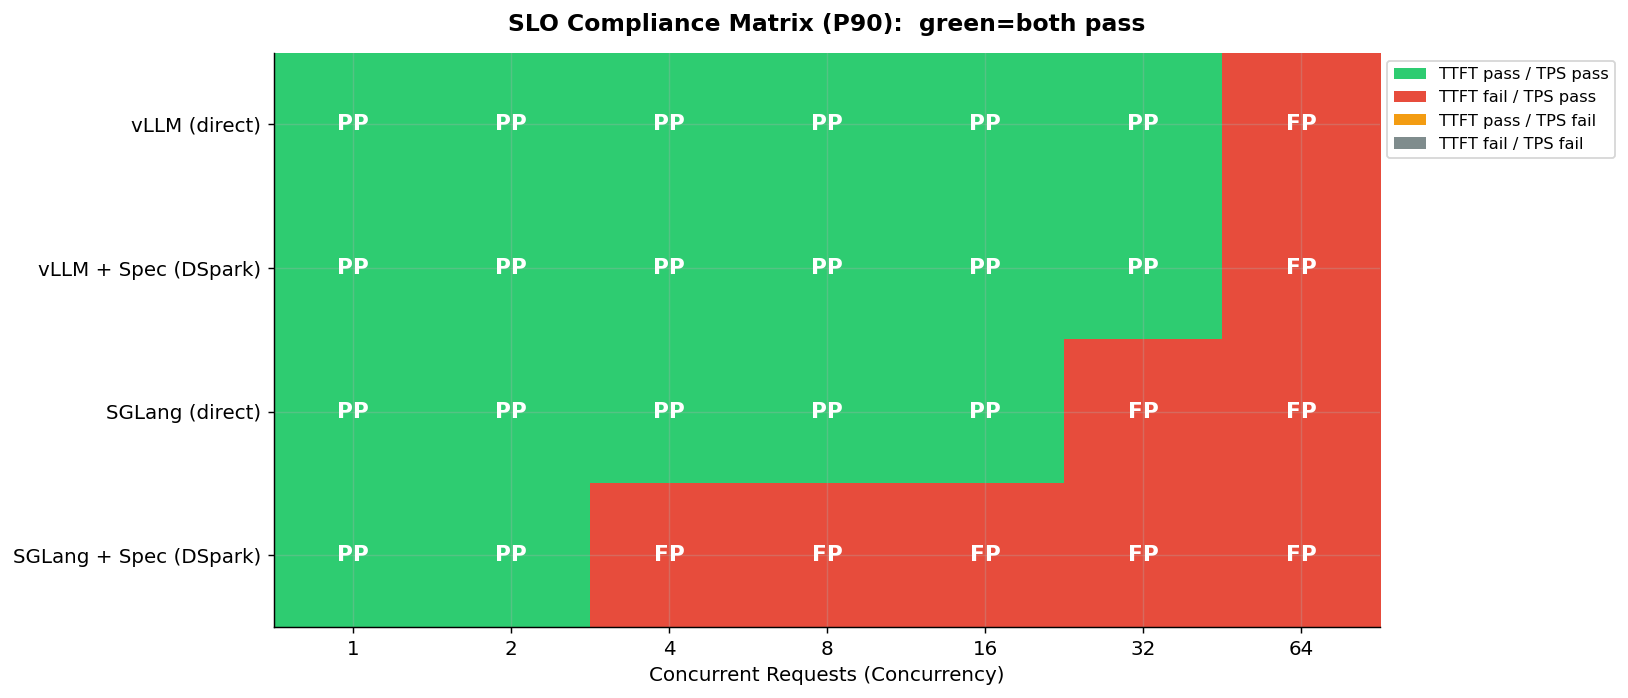
SLO status for each config/concurrency combination at the P90 percentile:
| Config | c=1 | c=2 | c=4 | c=8 | c=16 | c=32 | c=64 |
|---|---|---|---|---|---|---|---|
| vLLM direct | ✓✓ | ✓✓ | ✓✓ | ✓✓ | ✓✓ | ✓✓ | ✗✓ |
| vLLM + Spec | ✓✓ | ✓✓ | ✓✓ | ✓✓ | ✓✓ | ✓✓ | ✗✓ |
| SGLang direct | ✓✓ | ✓✓ | ✓✓ | ✓✓ | ✓✓ | ✗✓ | ✗✓ |
| SGLang + Spec | ✓✓ | ✓✓ | ✗✓ | ✗✓ | ✗✓ | ✗✓ | ✗✓ |
(✓/✗ = TTFT/TPS P90; first symbol TTFT, second TPS. ✓✓ = both pass, ✗✓ = only TPS passes, TTFT slightly exceeds SLO)
5.2 Maximum Concurrency (C_max) & Total Users (Little’s Law)
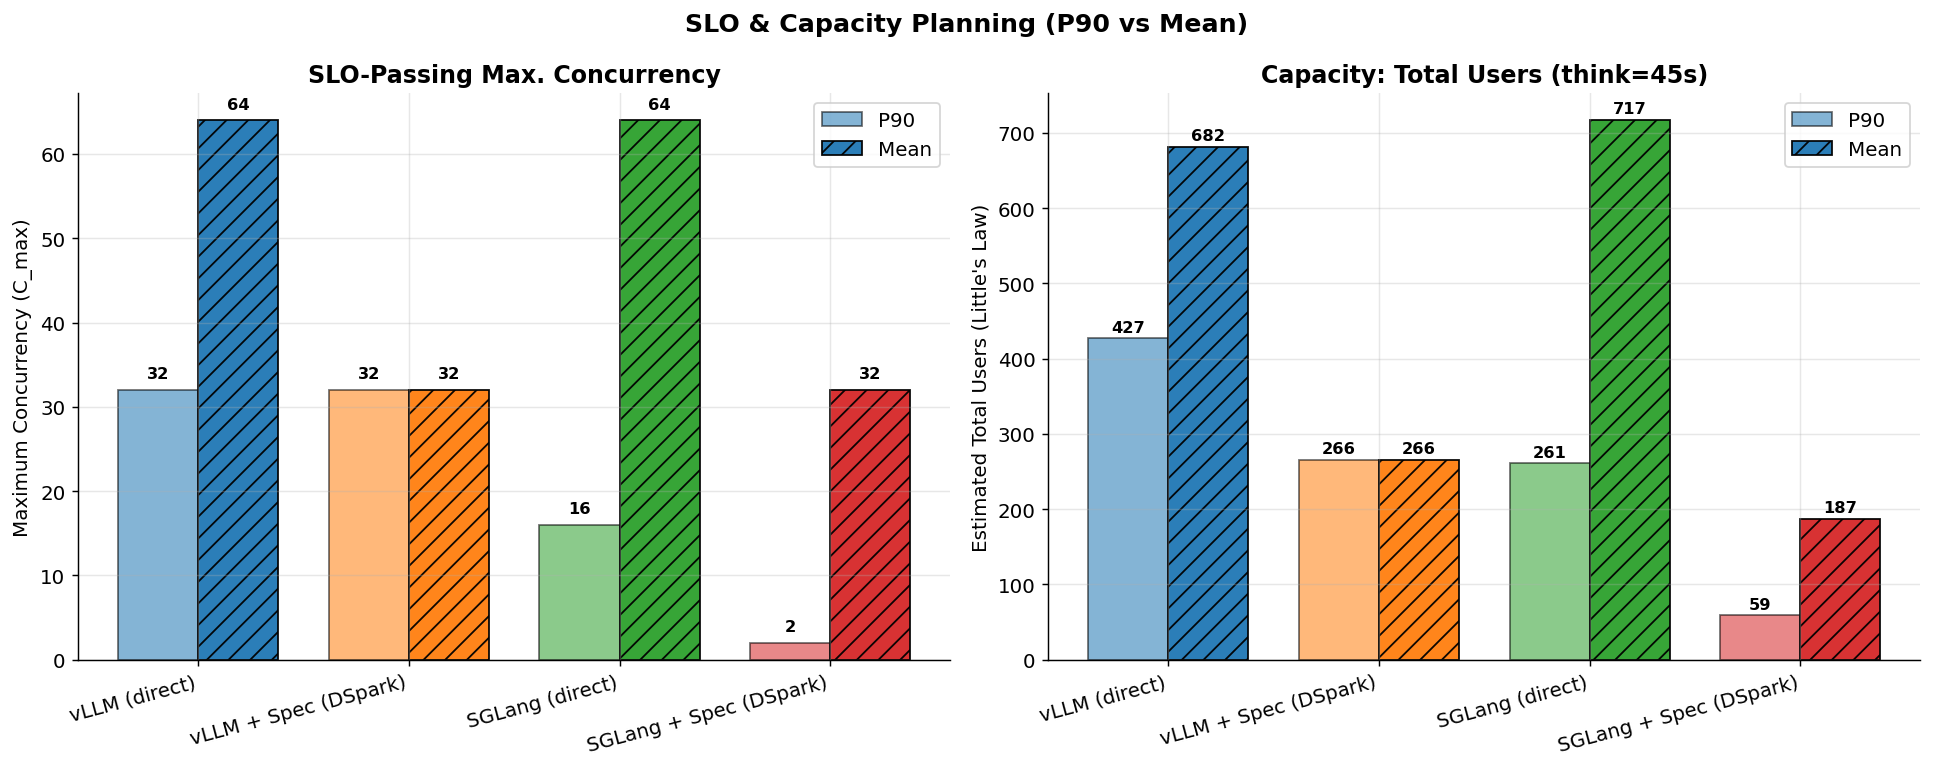
Total user count computed with N = C_max x (1 + 45s / L_mean):
P90-based (recommended for production — strict)
| Config | C_max (P90) | L_mean @ C_max (s) | Total Users (N) |
|---|---|---|---|
| vLLM direct | 32 | 3.65 | 427 |
| vLLM + Spec | 32 | 6.15 | 266 |
| SGLang direct | 16 | 2.94 | 261 |
| SGLang + Spec | 2 | 1.58 | 59 |
Mean-based (optimistic — for low load)
| Config | C_max (Mean) | L_mean @ C_max (s) | Total Users (N) |
|---|---|---|---|
| vLLM direct | 64 | 4.66 | 682 |
| vLLM + Spec | 32 | 6.15 | 266 |
| SGLang direct | 64 | 4.41 | 717 |
| SGLang + Spec | 32 | 9.28 | 187 |
5.3 Interpretation
- P90-based production capacity: vLLM direct is highest at 427 users. vLLM + Spec reaches the same C_max but its N is lower due to high latency (266).
- Mean-based: SGLang direct is highest at 717 — because at c=64 it still meets the SLO (mean). But since it cannot pass c=32 at P90, the Mean figure is optimistic.
- SGLang + Spec is the worst: breaks at c=2 at P90 — only suitable for very low load.
- Speculative decoding does not increase C_max — although it boosts per-user speed at low load, at high load it breaks the SLO and reduces total capacity.
6. Comparison Framework & Interpretation Guide
6.1 What This Benchmark Does
CordatusAI/llm-benchmark is designed to relatively compare LLM inference servers. It uses a fixed workload (128/128 tokens) to provide reproducible measurements.
6.2 Comparison Axes
This tool is suitable for comparison along 3 axes:
| Axis | Fixed | Variable |
|---|---|---|
| Inference Engine | Model + Hardware | vLLM vs SGLang vs TRT-LLM… |
| Model | Hardware + Engine | Kimi K3 vs Llama vs DeepSeek… or direct vs spec (different draft model) |
| Hardware | Model + Engine | DGX-B300 vs H100 vs MI300X… |
This Report Uses 2 Axes Simultaneously
This report does not cover a single axis but two axes simultaneously — the 4 configs form a 2x2 matrix:
| Direct (no draft model) | Speculative (DSpark draft model) | |
|---|---|---|
| vLLM | vLLM (direct) | vLLM + Spec (Inferact/Kimi-K3-DSpark) |
| SGLang | SGLang (direct) | SGLang + Spec (RadixArk/Kimi-K3-DSpark) |
- Inference engine axis (horizontal): Same model (Kimi K3), same hardware (DGX-B300),
same speculative mode — vLLM vs SGLang comparison.
- vLLM direct vs SGLang direct
- vLLM + Spec vs SGLang + Spec
- Model configuration axis (vertical): Same engine, same hardware — direct vs
speculative comparison. Since speculative decoding uses a different draft model, this is
technically a model-based comparison:
- vLLM direct vs vLLM + Spec (draft:
Inferact/Kimi-K3-DSpark) - SGLang direct vs SGLang + Spec (draft:
RadixArk/Kimi-K3-DSpark)
- vLLM direct vs vLLM + Spec (draft:
Important: Because vLLM and SGLang use different draft models, the “vLLM + Spec vs SGLang + Spec” comparison includes both the engine difference and the draft-model difference. This limitation should be kept in mind when directly comparing the two engines in speculative mode.
6.3 Workload Limitations (Important)
Keep in mind that these measurements do not represent real production workloads:
| Limitation | Explanation |
|---|---|
| Fixed 128/128 tokens | Real chat has 200-1000+ token output, variable length |
| Single-shot requests | Multi-turn context accumulation (KV cache hit) not measured |
| Full context active | --max-model-len 1048576 — 1M context overhead reflected in 128-token requests |
| Low input | Does not measure long-prompt (1K-32K) prefill behavior |
| Template prompts | Real user prompts show more varied distributions |
6.4 Interpreting Results
There Is No Standardized Usage Scenario
The same model (Kimi K3) is used in practice in very different load profiles, and none of them can be considered the “single correct” scenario:
- Chat: Single user, short input/output, low concurrency, short think time
- Agent: Multi-step, variable length, tool calls, medium concurrency
- Automation / Batch: High concurrency, long input/output, long think time
- API service: Mixed load, unpredictable concurrency/input/output distributions
Because of this diversity, concurrency, input, and output sizes cannot be predetermined — they vary by application nature, user behavior, and time of day. The 128/128 token + 45s think time measurements in this report represent a specific operating point; they do not exactly reflect real production workloads.
Unpredictable Variables in This Report
The following factors are fixed in this benchmark but variable in real use:
| Variable | In This Report | Real-World Range |
|---|---|---|
| Concurrency | 1-64 | 1-1000+ (application-dependent) |
| Input token | 128 (fixed) | 10-32K+ (prompt-content-dependent) |
| Output token | 128 (fixed) | 50-4096+ (task-dependent) |
| Think time | 45s (assumption) | 5s (fast interactive) - 120s (deep work) |
Observations for Consistent Interpretation
In light of the above limitations, this report’s results should be interpreted with the following observations:
- This report is valuable for relative ranking, not for absolute production estimation. Rather than “vLLM direct supports 427 users”, it is more consistent to say “vLLM direct supports 1.6x more users than vLLM + Spec”.
- P90 is a more realistic production indicator than Mean — tail latency is critical in production. Production-related decisions in this report are based on P90.
- The user counts computed via Little’s Law depend on the 45s think-time assumption; if your real application’s think time differs, the numbers change.
- The speculative decoding break-even point measured here is ~c16 for vLLM and ~c4 for SGLang; these points may shift under different workloads or hardware.
- The most suitable config depends on your target scenario’s load profile (see Section 8).
6.5 Impact of Full Context Deployment
The model was deployed with --max-model-len 1048576. This means 1M-token KV cache management
is performed for each request. The TTFT measured for a 128-token input is in fact the cost of
“processing 128 tokens on a system with 1M context capacity.”
Therefore, the prefill speeds measured here are not absolute prefill speed, but prefill
speed under the full-context configuration. With a shorter --max-model-len, KV cache usage
may differ and prefill speed may vary.
7. Conclusion
Four different inference-engine configurations of the Kimi K3 model were compared on DGX-B300: vLLM (direct), vLLM + DSpark speculative, SGLang (direct), and SGLang + DSpark speculative.
Measured behaviors:
- At low load (c<=4): Speculative decoding increases per-user TPS by 1.4-1.9x and halves ITL (vLLM: 9.5ms -> 4.8ms).
- Break-even points: ~c16 for vLLM, ~c4 for SGLang. Beyond that, speculative decoding underperforms direct.
- At high load (c=64): vLLM + Spec’s per-user TPS drops to 11 tok/s (vLLM direct 27 tok/s). Aggregate output drops from c=32 to c=64 for vLLM+Spec.
- SGLang direct’s TTFT is higher than vLLM direct’s (400ms vs 66ms at c=1) — this difference stems from the engines’ prefill-backend configuration (see Section 3.4).
- SGLang + Spec @c=64 anomaly: TTFT 4752ms (was 777ms at c=32).
Important: All results are for relative comparison. They are based on a 128/128 token fixed workload and a 45s think-time assumption. A separate benchmark is recommended for real production workloads.
Appendix A: All CSV Data
A.1 vLLM (direct)
| c | TTFT Mean | TTFT P90 | ITL Mean | ITL P90 | TPS Mean | TPS P90 | Lat Mean | Lat P90 | RPS |
|---|---|---|---|---|---|---|---|---|---|
| 1 | 66.5 | 70.5 | 9.46 | 9.47 | 100.84 | 101.30 | 1.27 | 1.27 | 0.79 |
| 2 | 105.5 | 154.9 | 11.16 | 11.58 | 83.98 | 83.99 | 1.52 | 1.54 | 0.66 |
| 4 | 145.9 | 197.6 | 12.61 | 13.22 | 73.17 | 74.47 | 1.75 | 1.77 | 0.57 |
| 8 | 388.0 | 520.9 | 15.59 | 17.57 | 54.03 | 56.11 | 2.37 | 2.44 | 0.42 |
| 16 | 543.8 | 693.4 | 18.54 | 20.95 | 43.95 | 46.19 | 2.92 | 3.18 | 0.34 |
| 32 | 608.1 | 887.5 | 23.56 | 25.73 | 35.18 | 38.43 | 3.65 | 3.95 | 0.27 |
| 64 | 731.7 | 1107.0 | 30.82 | 33.77 | 27.49 | 28.59 | 4.66 | 4.85 | 0.21 |
A.2 vLLM + Spec (DSpark)
| c | TTFT Mean | TTFT P90 | ITL Mean | ITL P90 | TPS Mean | TPS P90 | Lat Mean | Lat P90 | RPS |
|---|---|---|---|---|---|---|---|---|---|
| 1 | 71.0 | 77.8 | 4.84 | 5.74 | 187.74 | 201.34 | 0.69 | 0.80 | 1.46 |
| 2 | 172.9 | 191.2 | 6.67 | 8.15 | 129.75 | 167.10 | 1.02 | 1.18 | 0.98 |
| 4 | 191.5 | 265.9 | 9.11 | 12.07 | 99.43 | 127.29 | 1.35 | 1.74 | 0.74 |
| 8 | 262.9 | 455.0 | 15.89 | 24.13 | 61.04 | 81.74 | 2.28 | 3.35 | 0.44 |
| 16 | 344.3 | 594.2 | 21.69 | 28.15 | 43.60 | 59.14 | 3.10 | 3.98 | 0.32 |
| 32 | 565.2 | 802.0 | 43.93 | 59.60 | 23.14 | 30.79 | 6.15 | 8.16 | 0.16 |
| 64 | 1030.9 | 1465.5 | 95.38 | 135.86 | 11.21 | 16.51 | 13.15 | 18.35 | 0.08 |
A.3 SGLang (direct)
| c | TTFT Mean | TTFT P90 | ITL Mean | ITL P90 | TPS Mean | TPS P90 | Lat Mean | Lat P90 | RPS |
|---|---|---|---|---|---|---|---|---|---|
| 1 | 399.5 | 397.2 | 8.94 | 8.95 | 83.40 | 84.44 | 1.54 | 1.54 | 0.65 |
| 2 | 771.7 | 786.9 | 9.72 | 9.79 | 63.79 | 64.99 | 2.01 | 2.03 | 0.50 |
| 4 | 811.0 | 948.2 | 10.65 | 10.73 | 59.33 | 61.42 | 2.17 | 2.30 | 0.46 |
| 8 | 782.6 | 820.6 | 12.89 | 13.18 | 52.88 | 54.17 | 2.42 | 2.52 | 0.41 |
| 16 | 833.6 | 948.8 | 16.53 | 17.06 | 43.54 | 44.88 | 2.94 | 3.06 | 0.34 |
| 32 | 915.2 | 1204.5 | 23.34 | 24.84 | 33.55 | 36.56 | 3.92 | 4.03 | 0.26 |
| 64 | 948.4 | 1263.5 | 27.08 | 27.32 | 29.11 | 30.20 | 4.41 | 4.74 | 0.23 |
A.4 SGLang + Spec (DSpark)
| c | TTFT Mean | TTFT P90 | ITL Mean | ITL P90 | TPS Mean | TPS P90 | Lat Mean | Lat P90 | RPS |
|---|---|---|---|---|---|---|---|---|---|
| 1 | 450.6 | 630.0 | 4.26 | 4.94 | 129.86 | 142.68 | 0.99 | 1.09 | 1.01 |
| 2 | 484.6 | 495.7 | 8.59 | 12.98 | 87.02 | 122.46 | 1.58 | 2.19 | 0.63 |
| 4 | 588.3 | 1111.4 | 14.39 | 23.24 | 56.92 | 72.54 | 2.42 | 3.36 | 0.41 |
| 8 | 610.3 | 1070.4 | 23.56 | 32.04 | 37.78 | 50.83 | 3.60 | 4.76 | 0.28 |
| 16 | 745.1 | 1155.4 | 61.29 | 79.10 | 22.16 | 33.99 | 8.53 | 10.85 | 0.12 |
| 32 | 776.9 | 1166.4 | 66.93 | 90.59 | 15.42 | 20.27 | 9.28 | 12.20 | 0.11 |
| 64 | 4752.6 | 5252.9 | 34.40 | 45.13 | 14.54 | 16.78 | 9.13 | 10.77 | 0.11 |
Appendix B: Comparison Charts
The following charts were produced for this report (karsilastirma-en/ folder):
| # | File | Content |
|---|---|---|
| 1 | 01-TTFT.png |
TTFT Mean + P90, 4 configs |
| 2 | 02-ITL.png |
ITL Mean + P90, 4 configs |
| 3 | 03-TPS.png |
Per-User TPS Mean + P90, 4 configs |
| 4 | 04-Latency.png |
Latency Mean + P90, 4 configs |
| 5 | 05-Throughput.png |
Throughput (RPS), 4 configs |
| 6 | 06-Kapasite.png |
C_max + Little’s Law N (P90 & Mean) |
| 7 | 07-Aggregate-Output.png |
Total produced tok/s (TPS x c) |
| 8 | 08-Spec-Speedup.png |
Spec/Direct TPS ratio, break-even |
| 9 | 09-SLO-Heatmap.png |
SLO compliance matrix (P90) |
| 10 | 10-Dashboard.png |
2x3 grid summary (Mean values) |
B.1 Summary at a Glance (Dashboard)
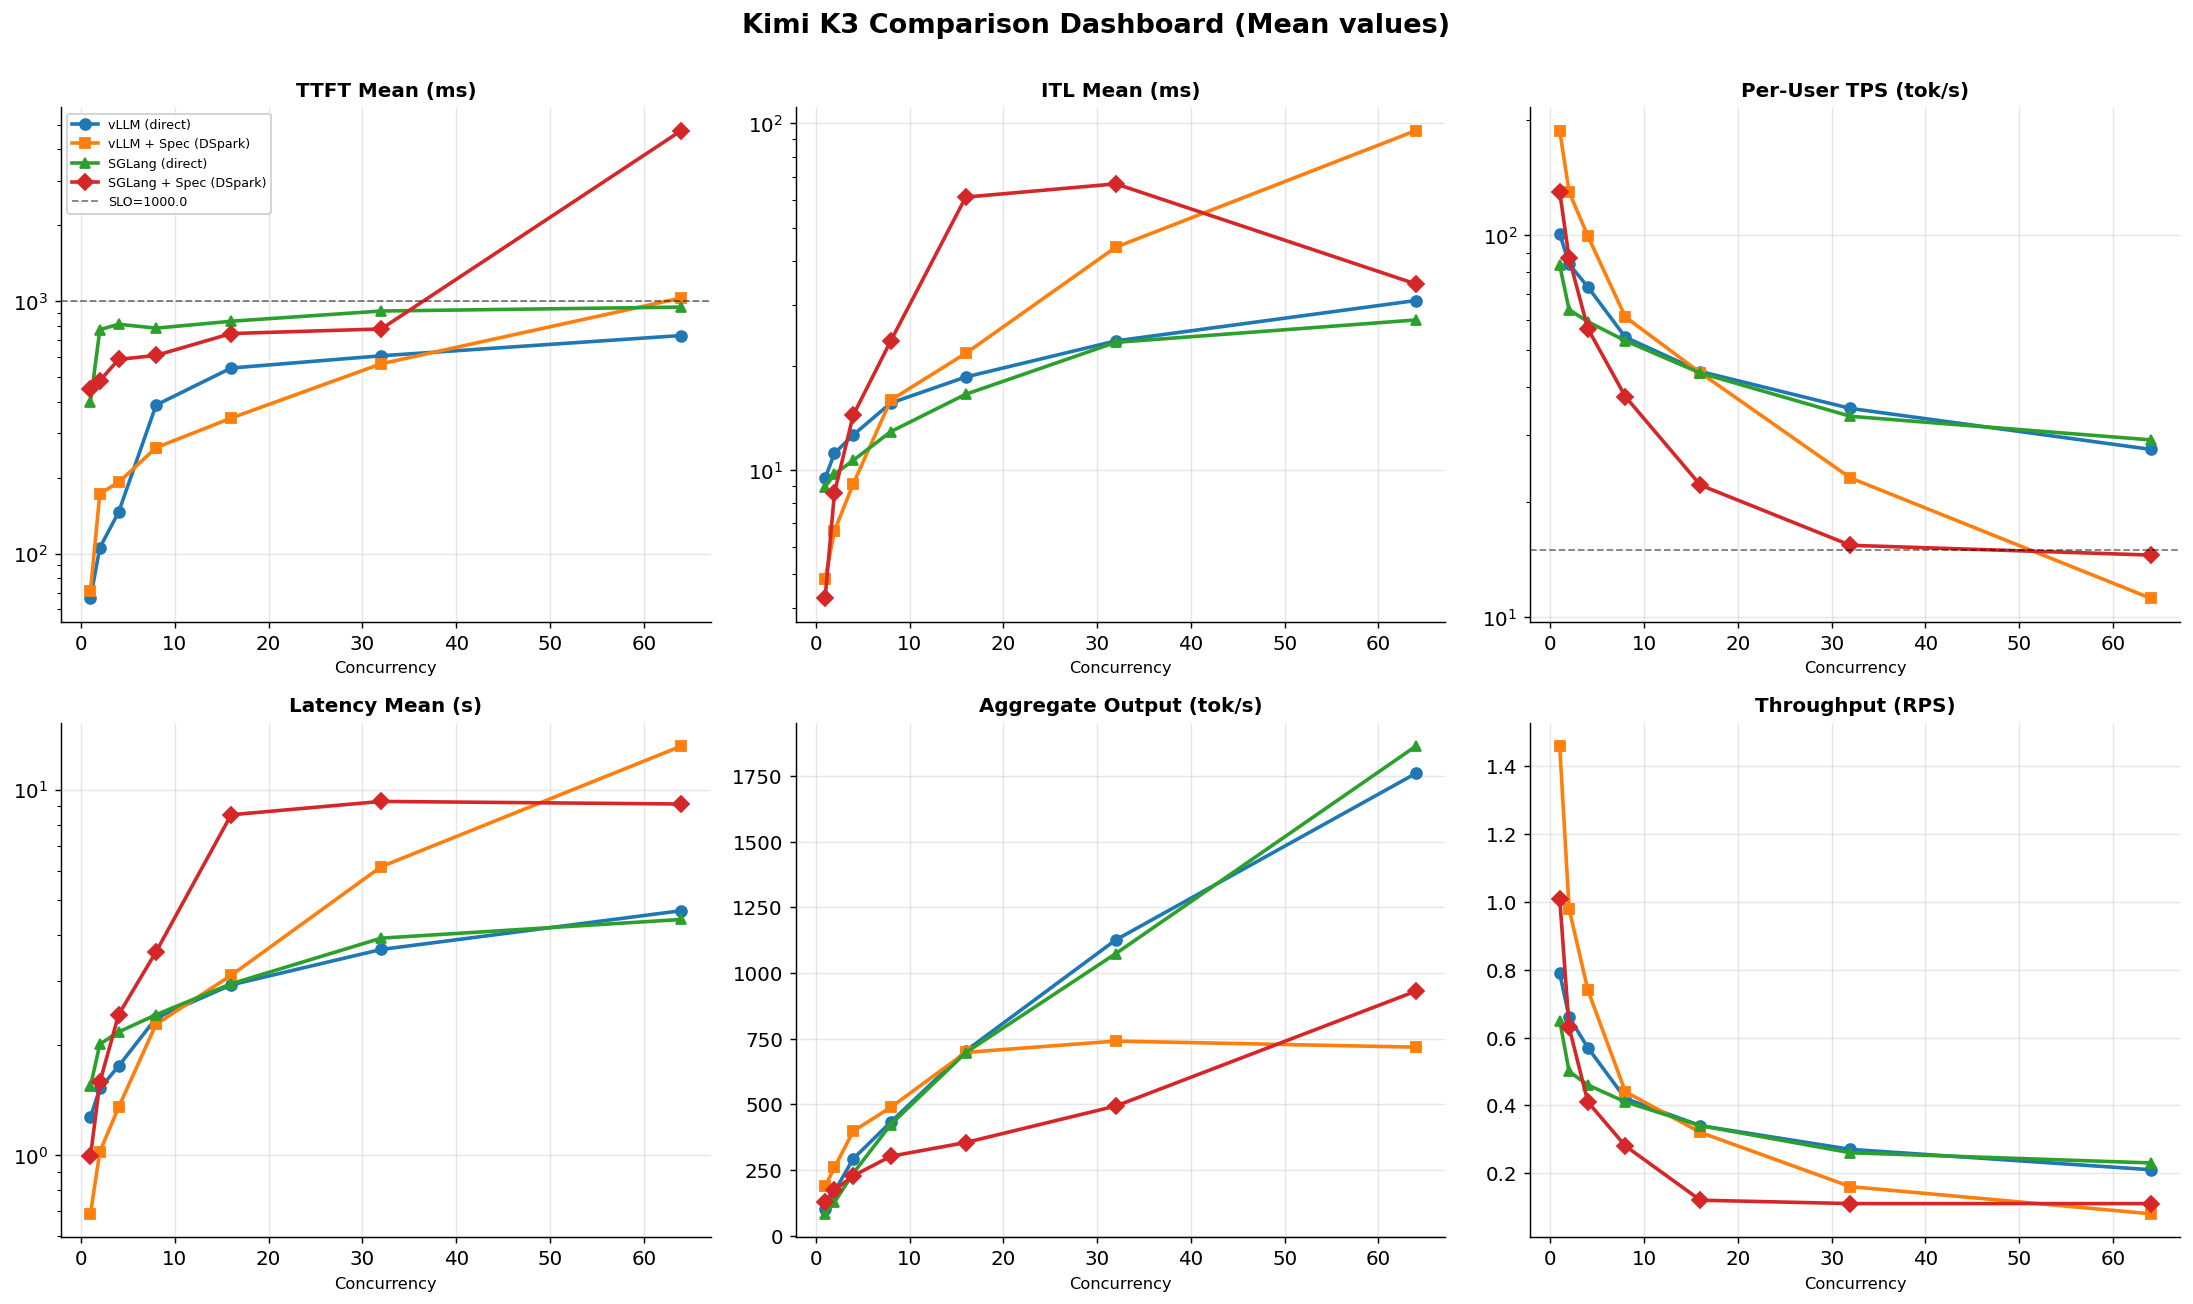
This report was generated from measurements produced with the CordatusAI/llm-benchmark tool. Deployment commands are taken from vLLM’s and SGLang’s official Kimi K3 recipes. Charts were produced with matplotlib 3.7.5 + plotly 6.8.0. Report date: July 2026